EXPLORE THE MEASUREMENTS
A closer look.
All 20 plates.
Archived observations from 24 October 2026. Open a chart to enlarge it, or download its PNG/SVG. References use the operator-confirmed layout and have not been independently surveyed.
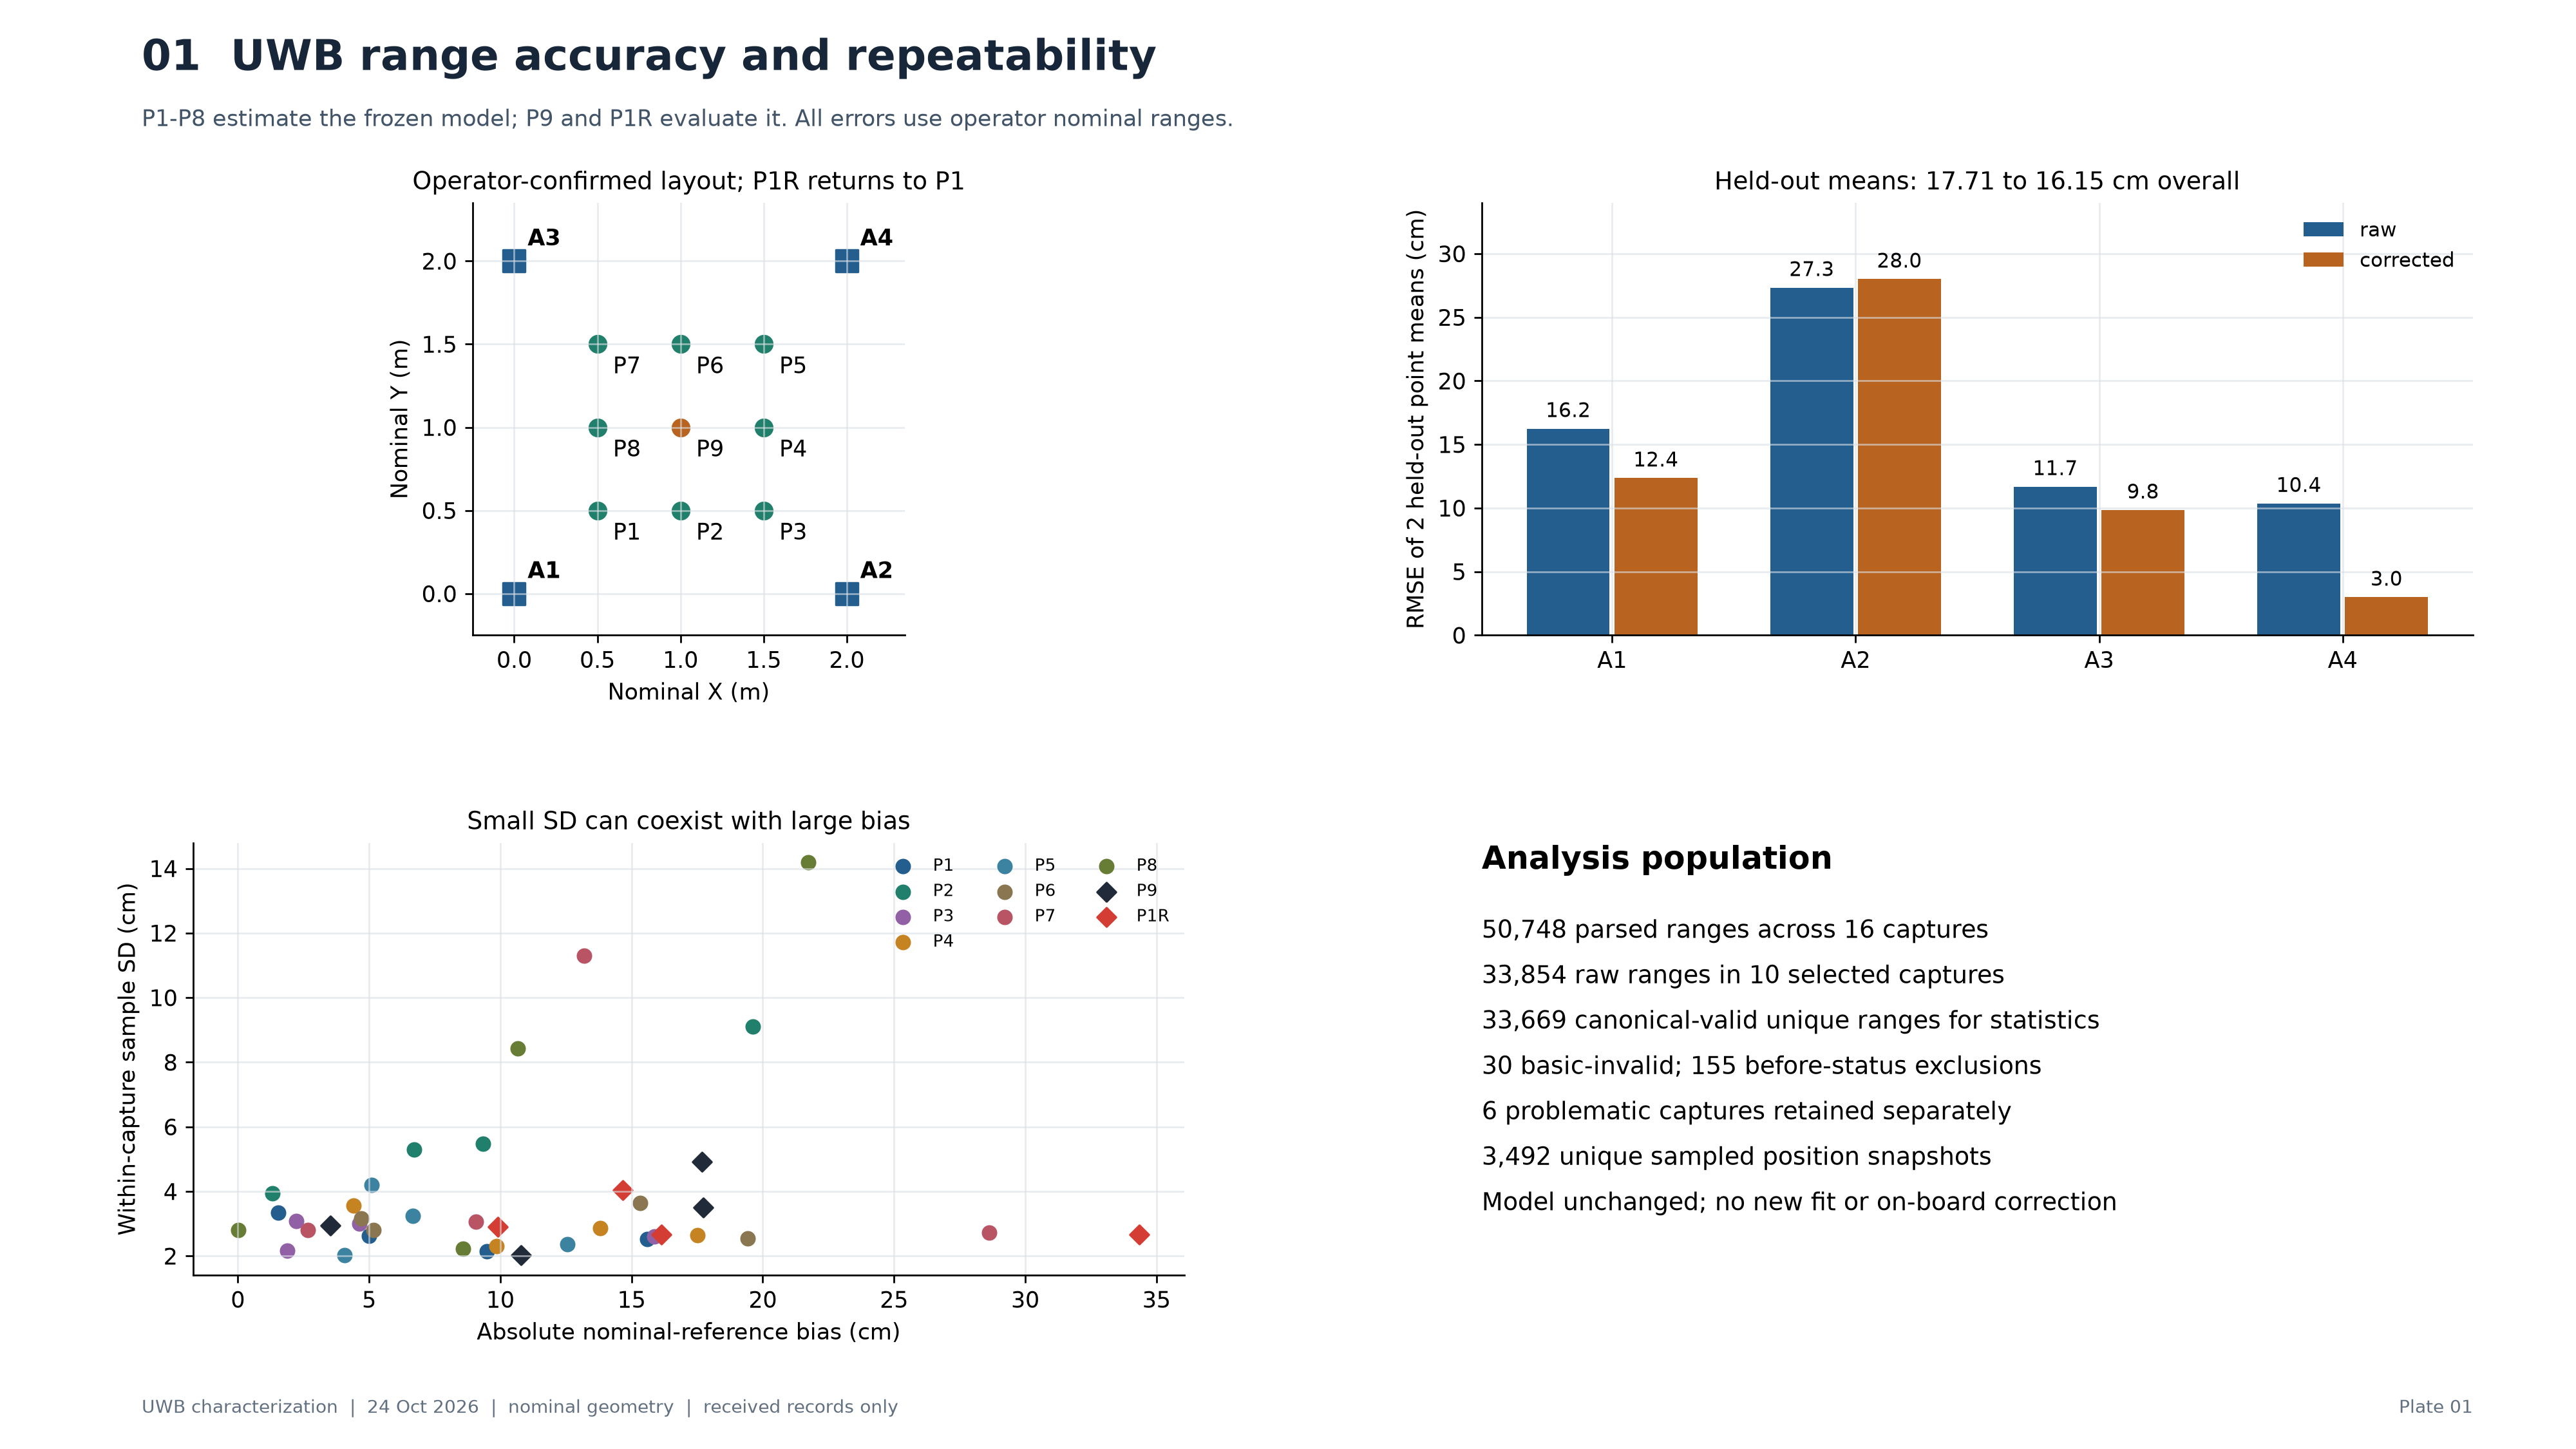
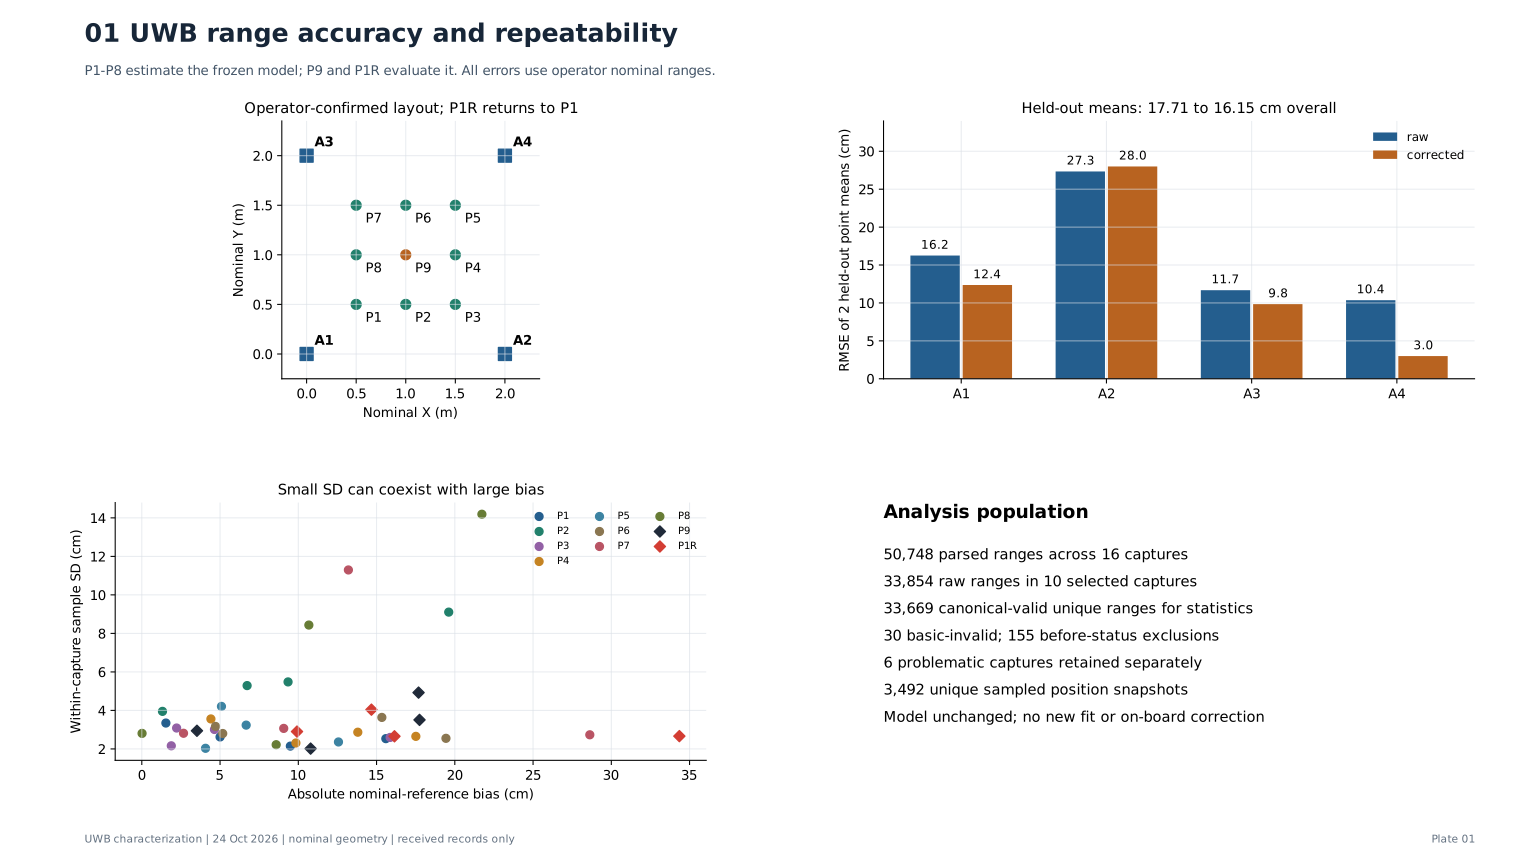
UWB range accuracy and repeatability
Bias measures mean error against the nominal reference. SD describes dispersion within a capture. Neither independently establishes traceable absolute accuracy. Primary validation gives equal weight to eight point-anchor means.
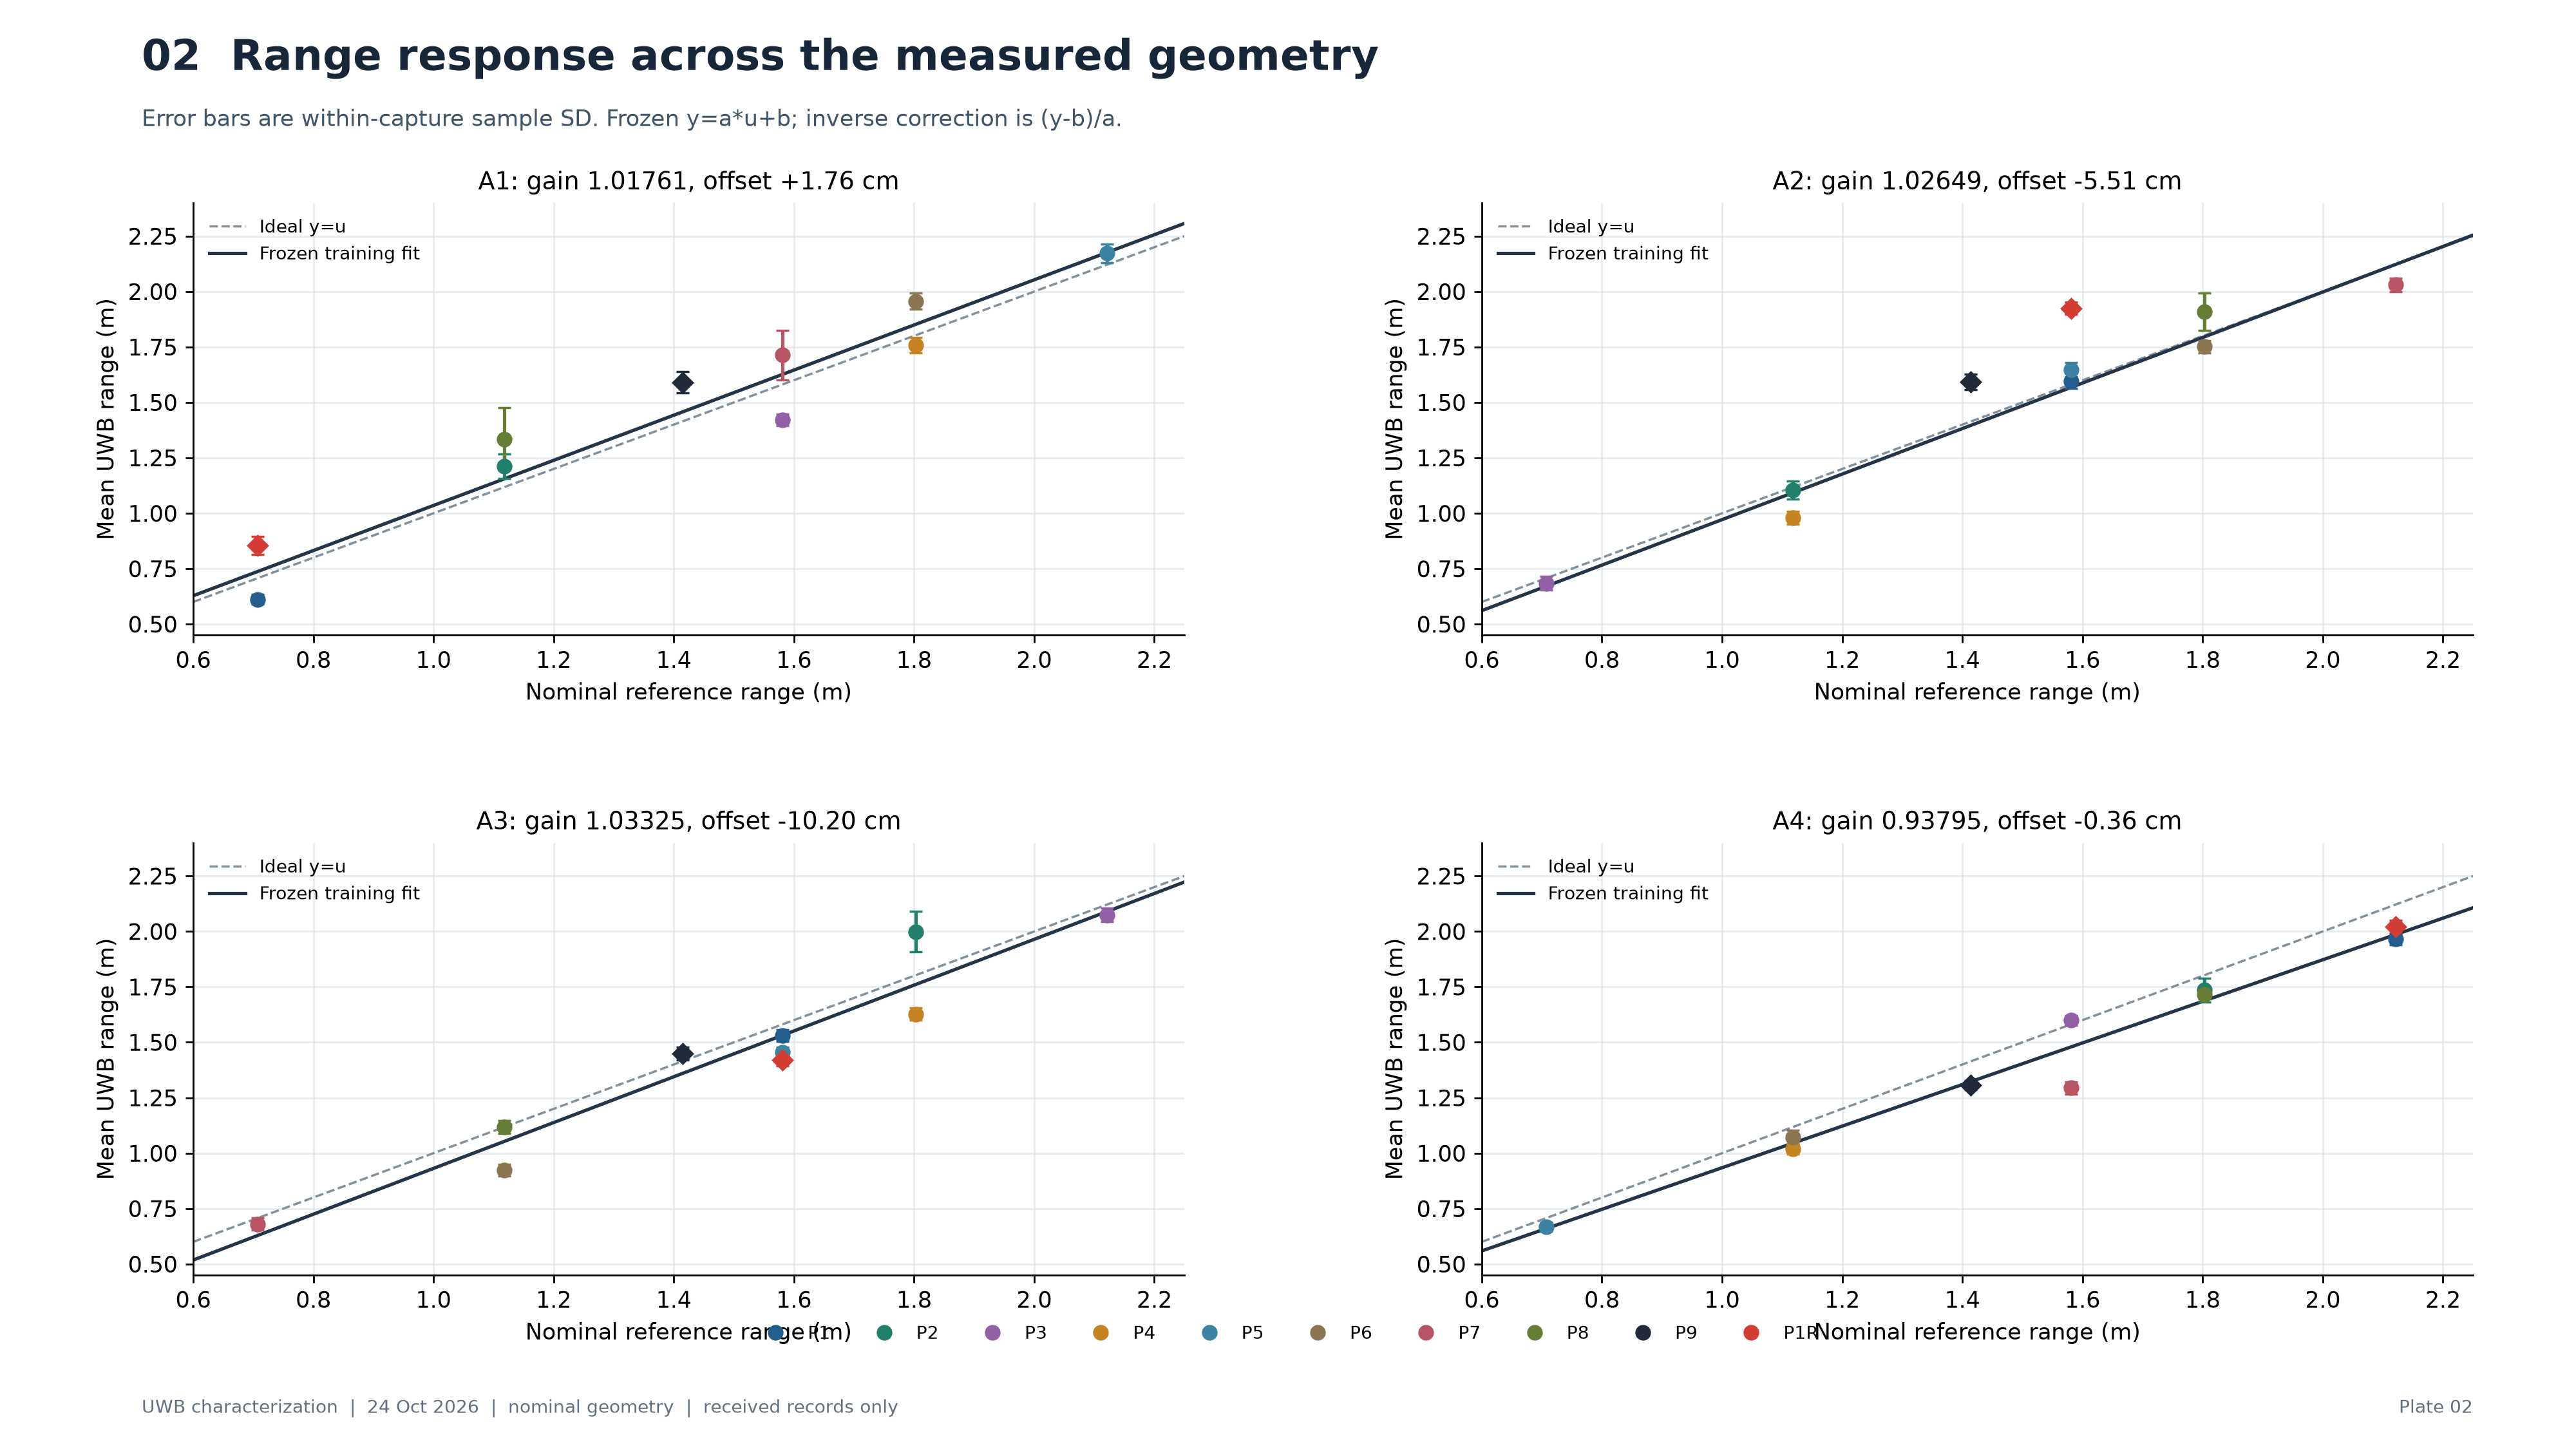
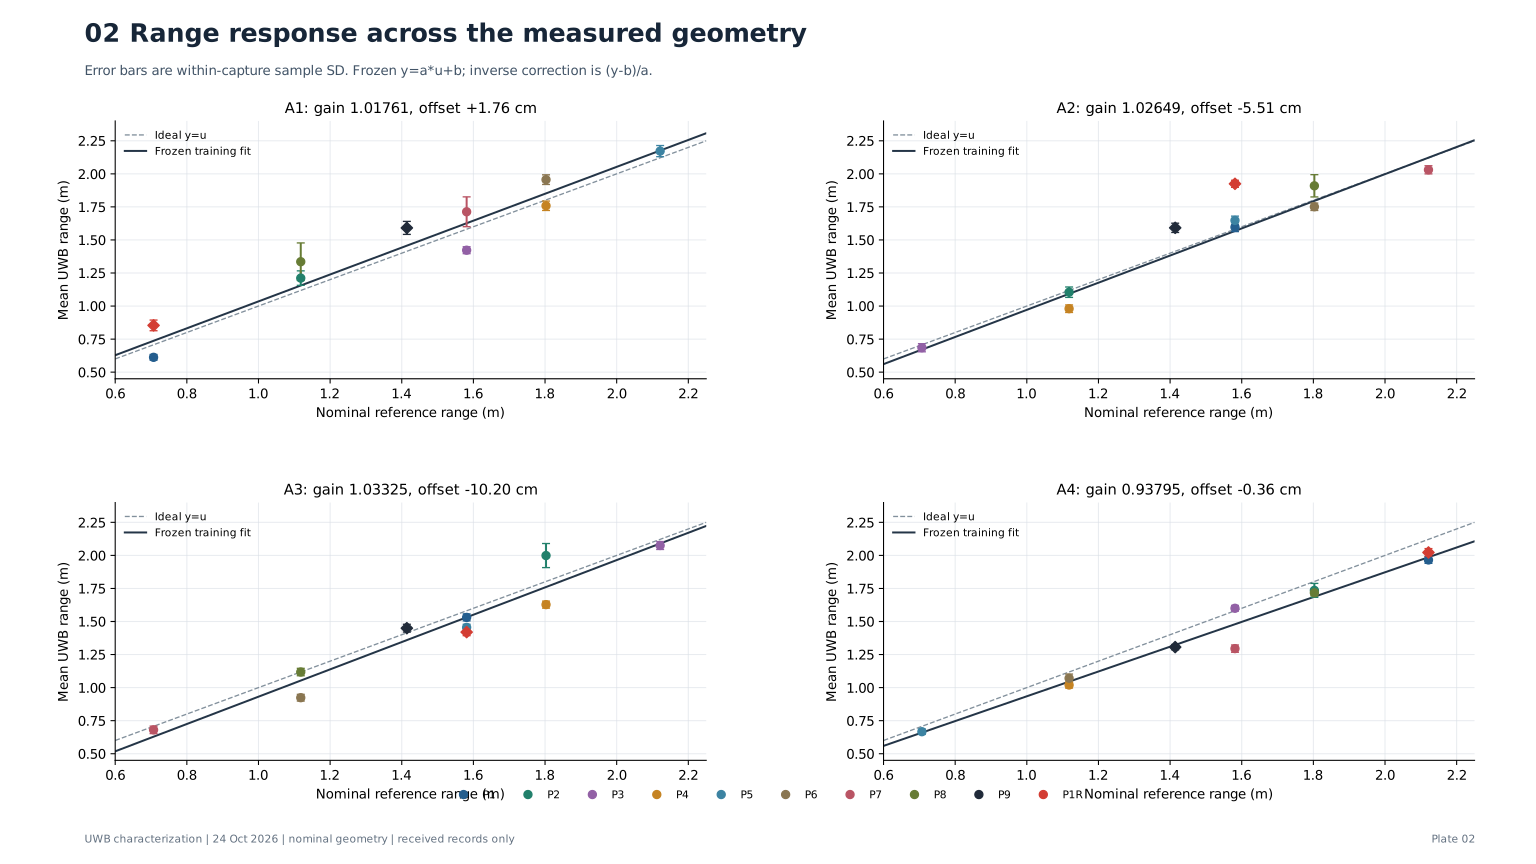
Range response across the measured geometry
Only the eight P1-P8 point means per anchor were used for the existing fit. Held-out diamonds are not fitted here. No extrapolation beyond the tested nominal ranges is supported.
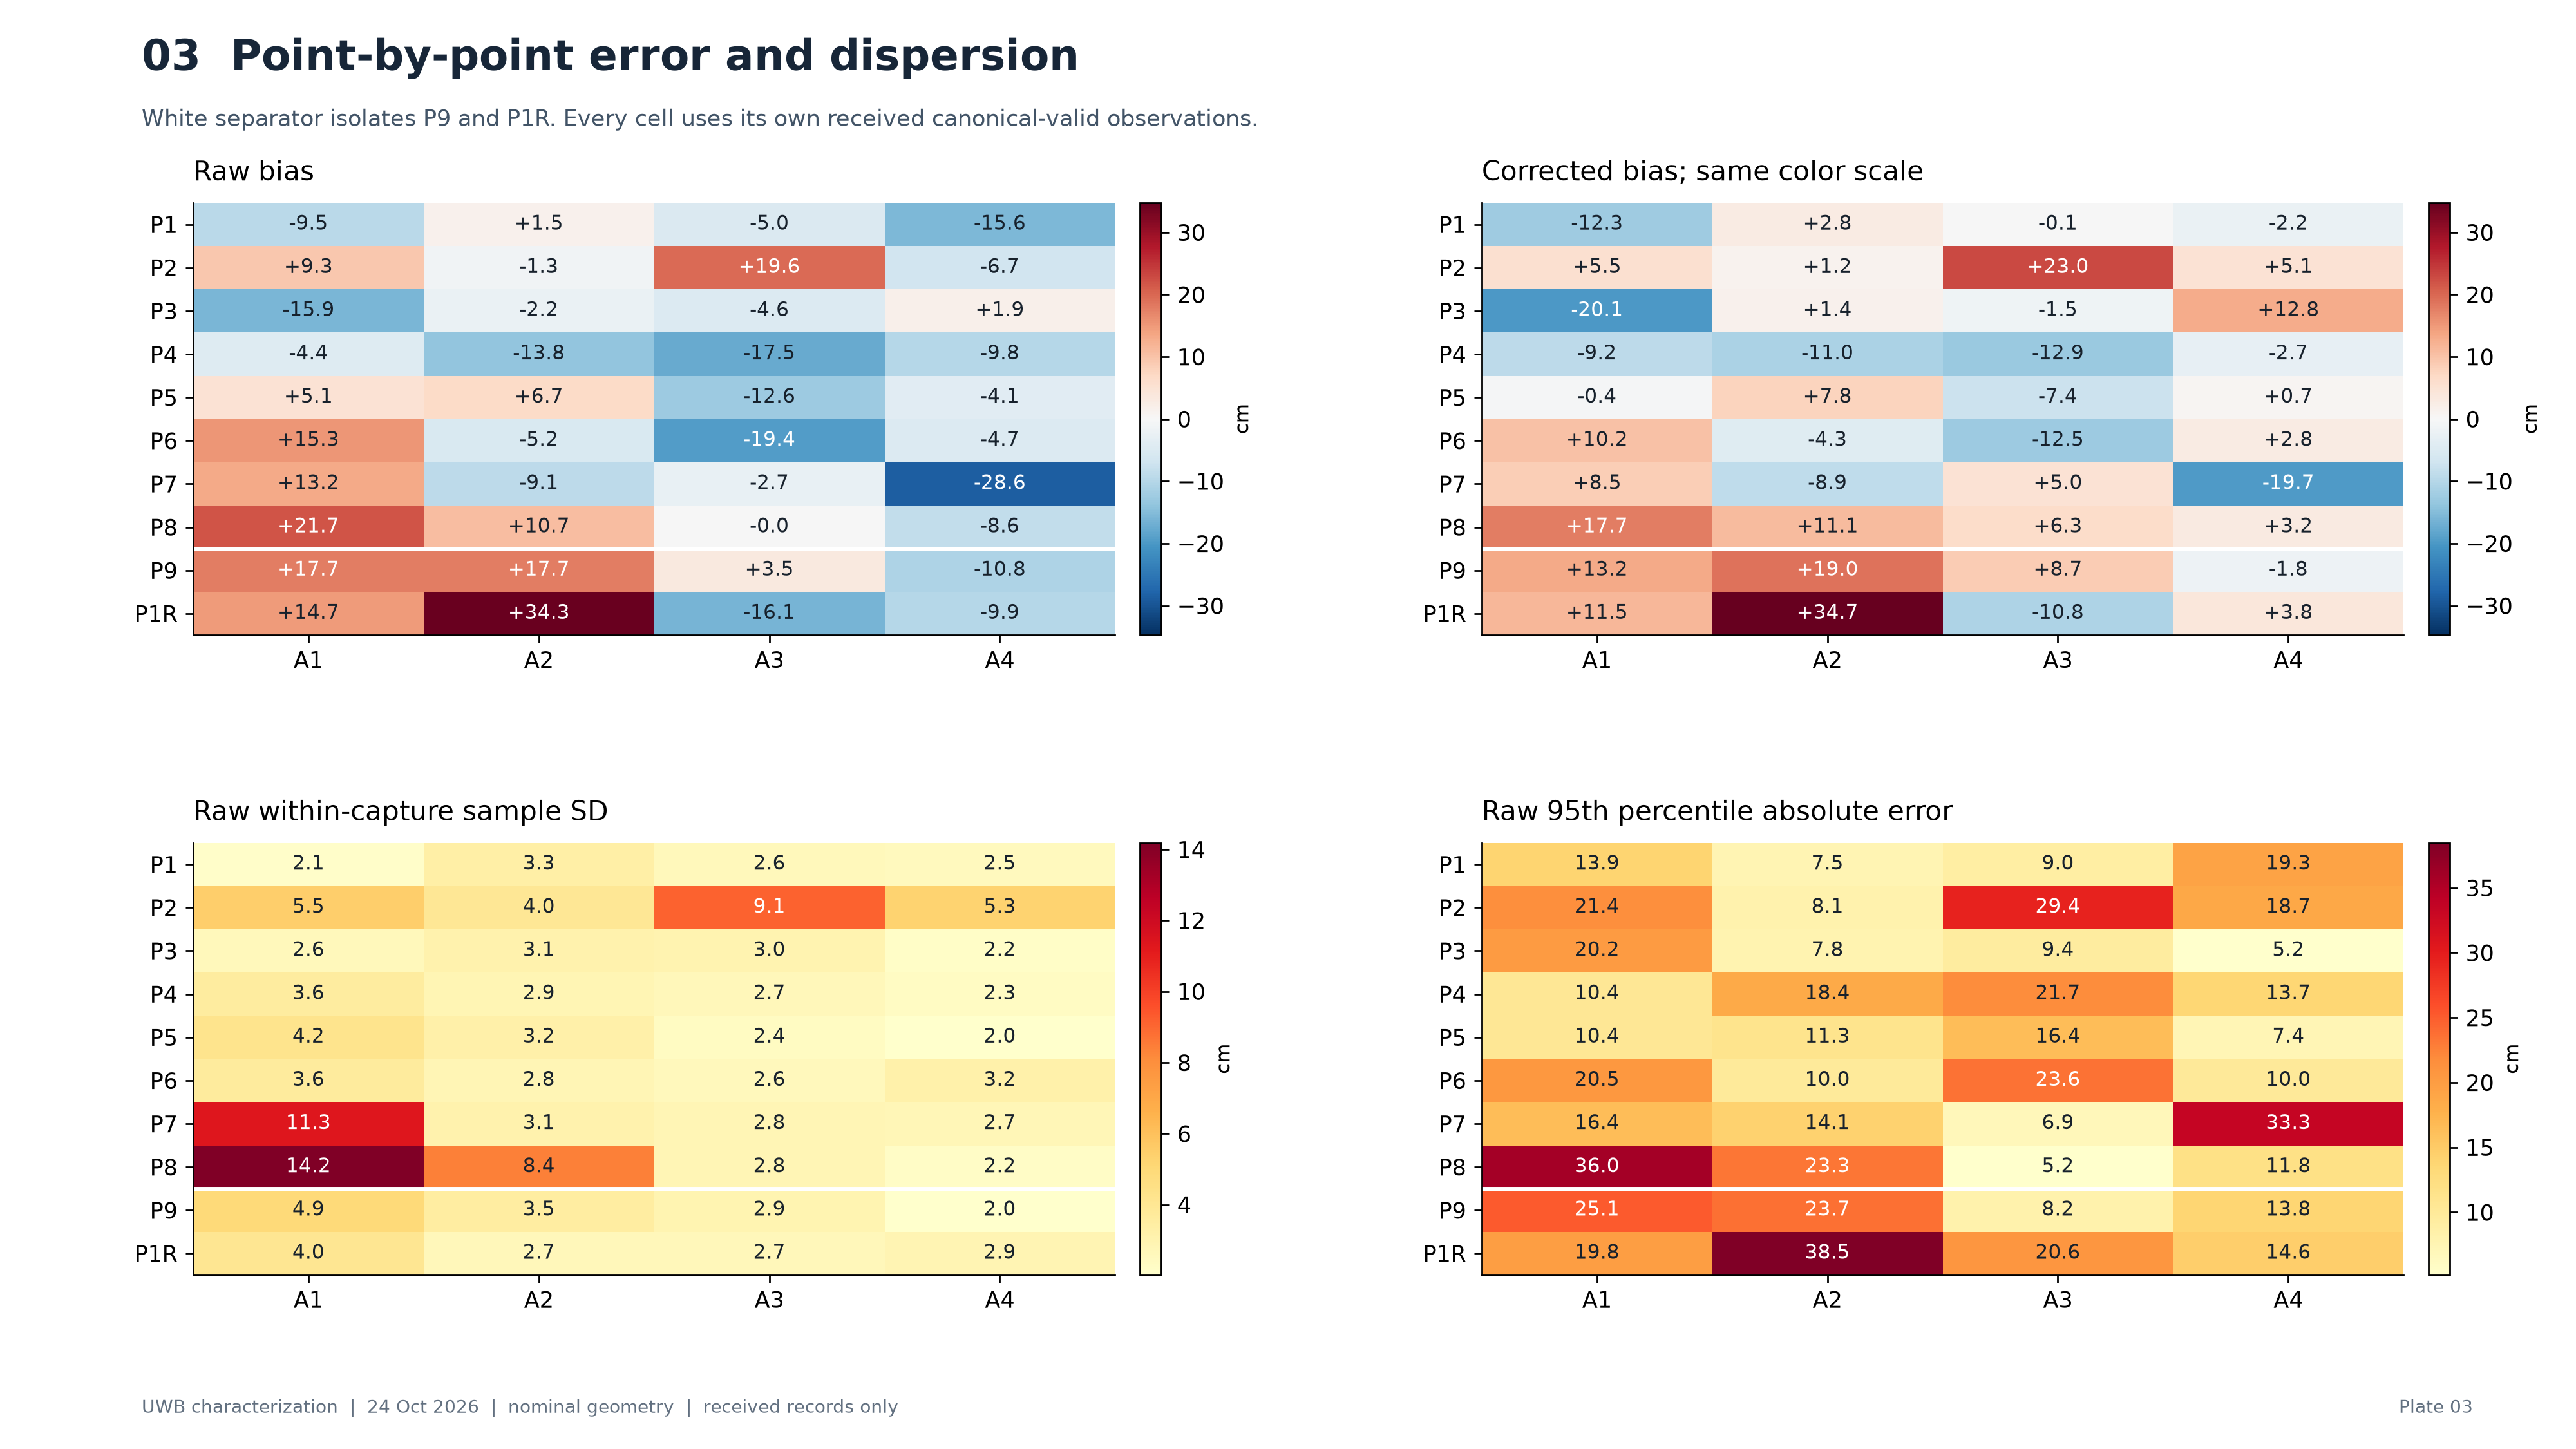
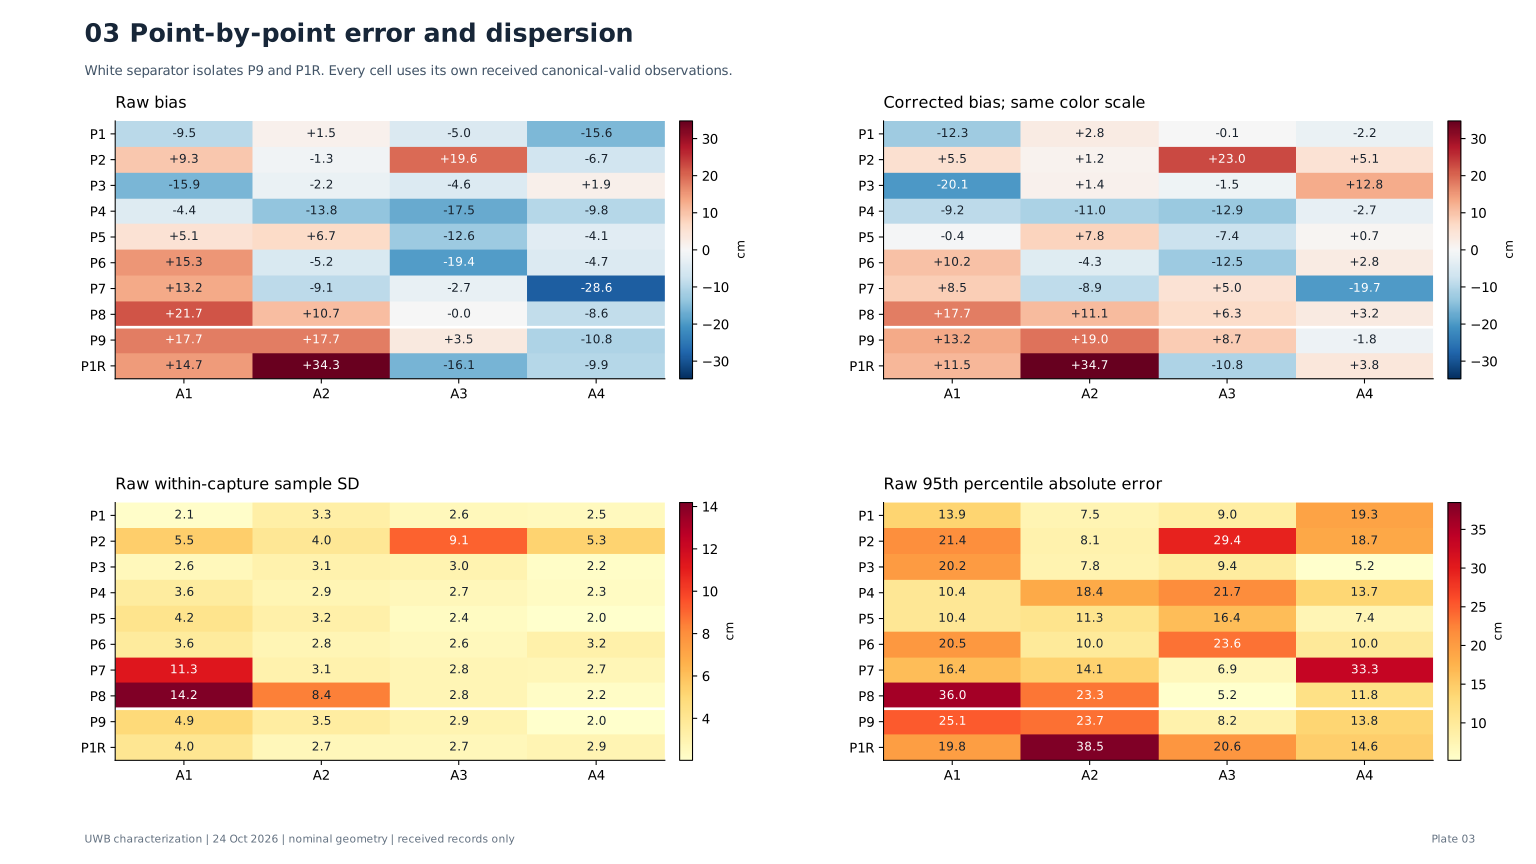
Point-by-point error and dispersion
P95 is an empirical quantile of absolute sample errors, not a 95% confidence interval, tolerance bound or guarantee. Positive outliers remain in the statistics.
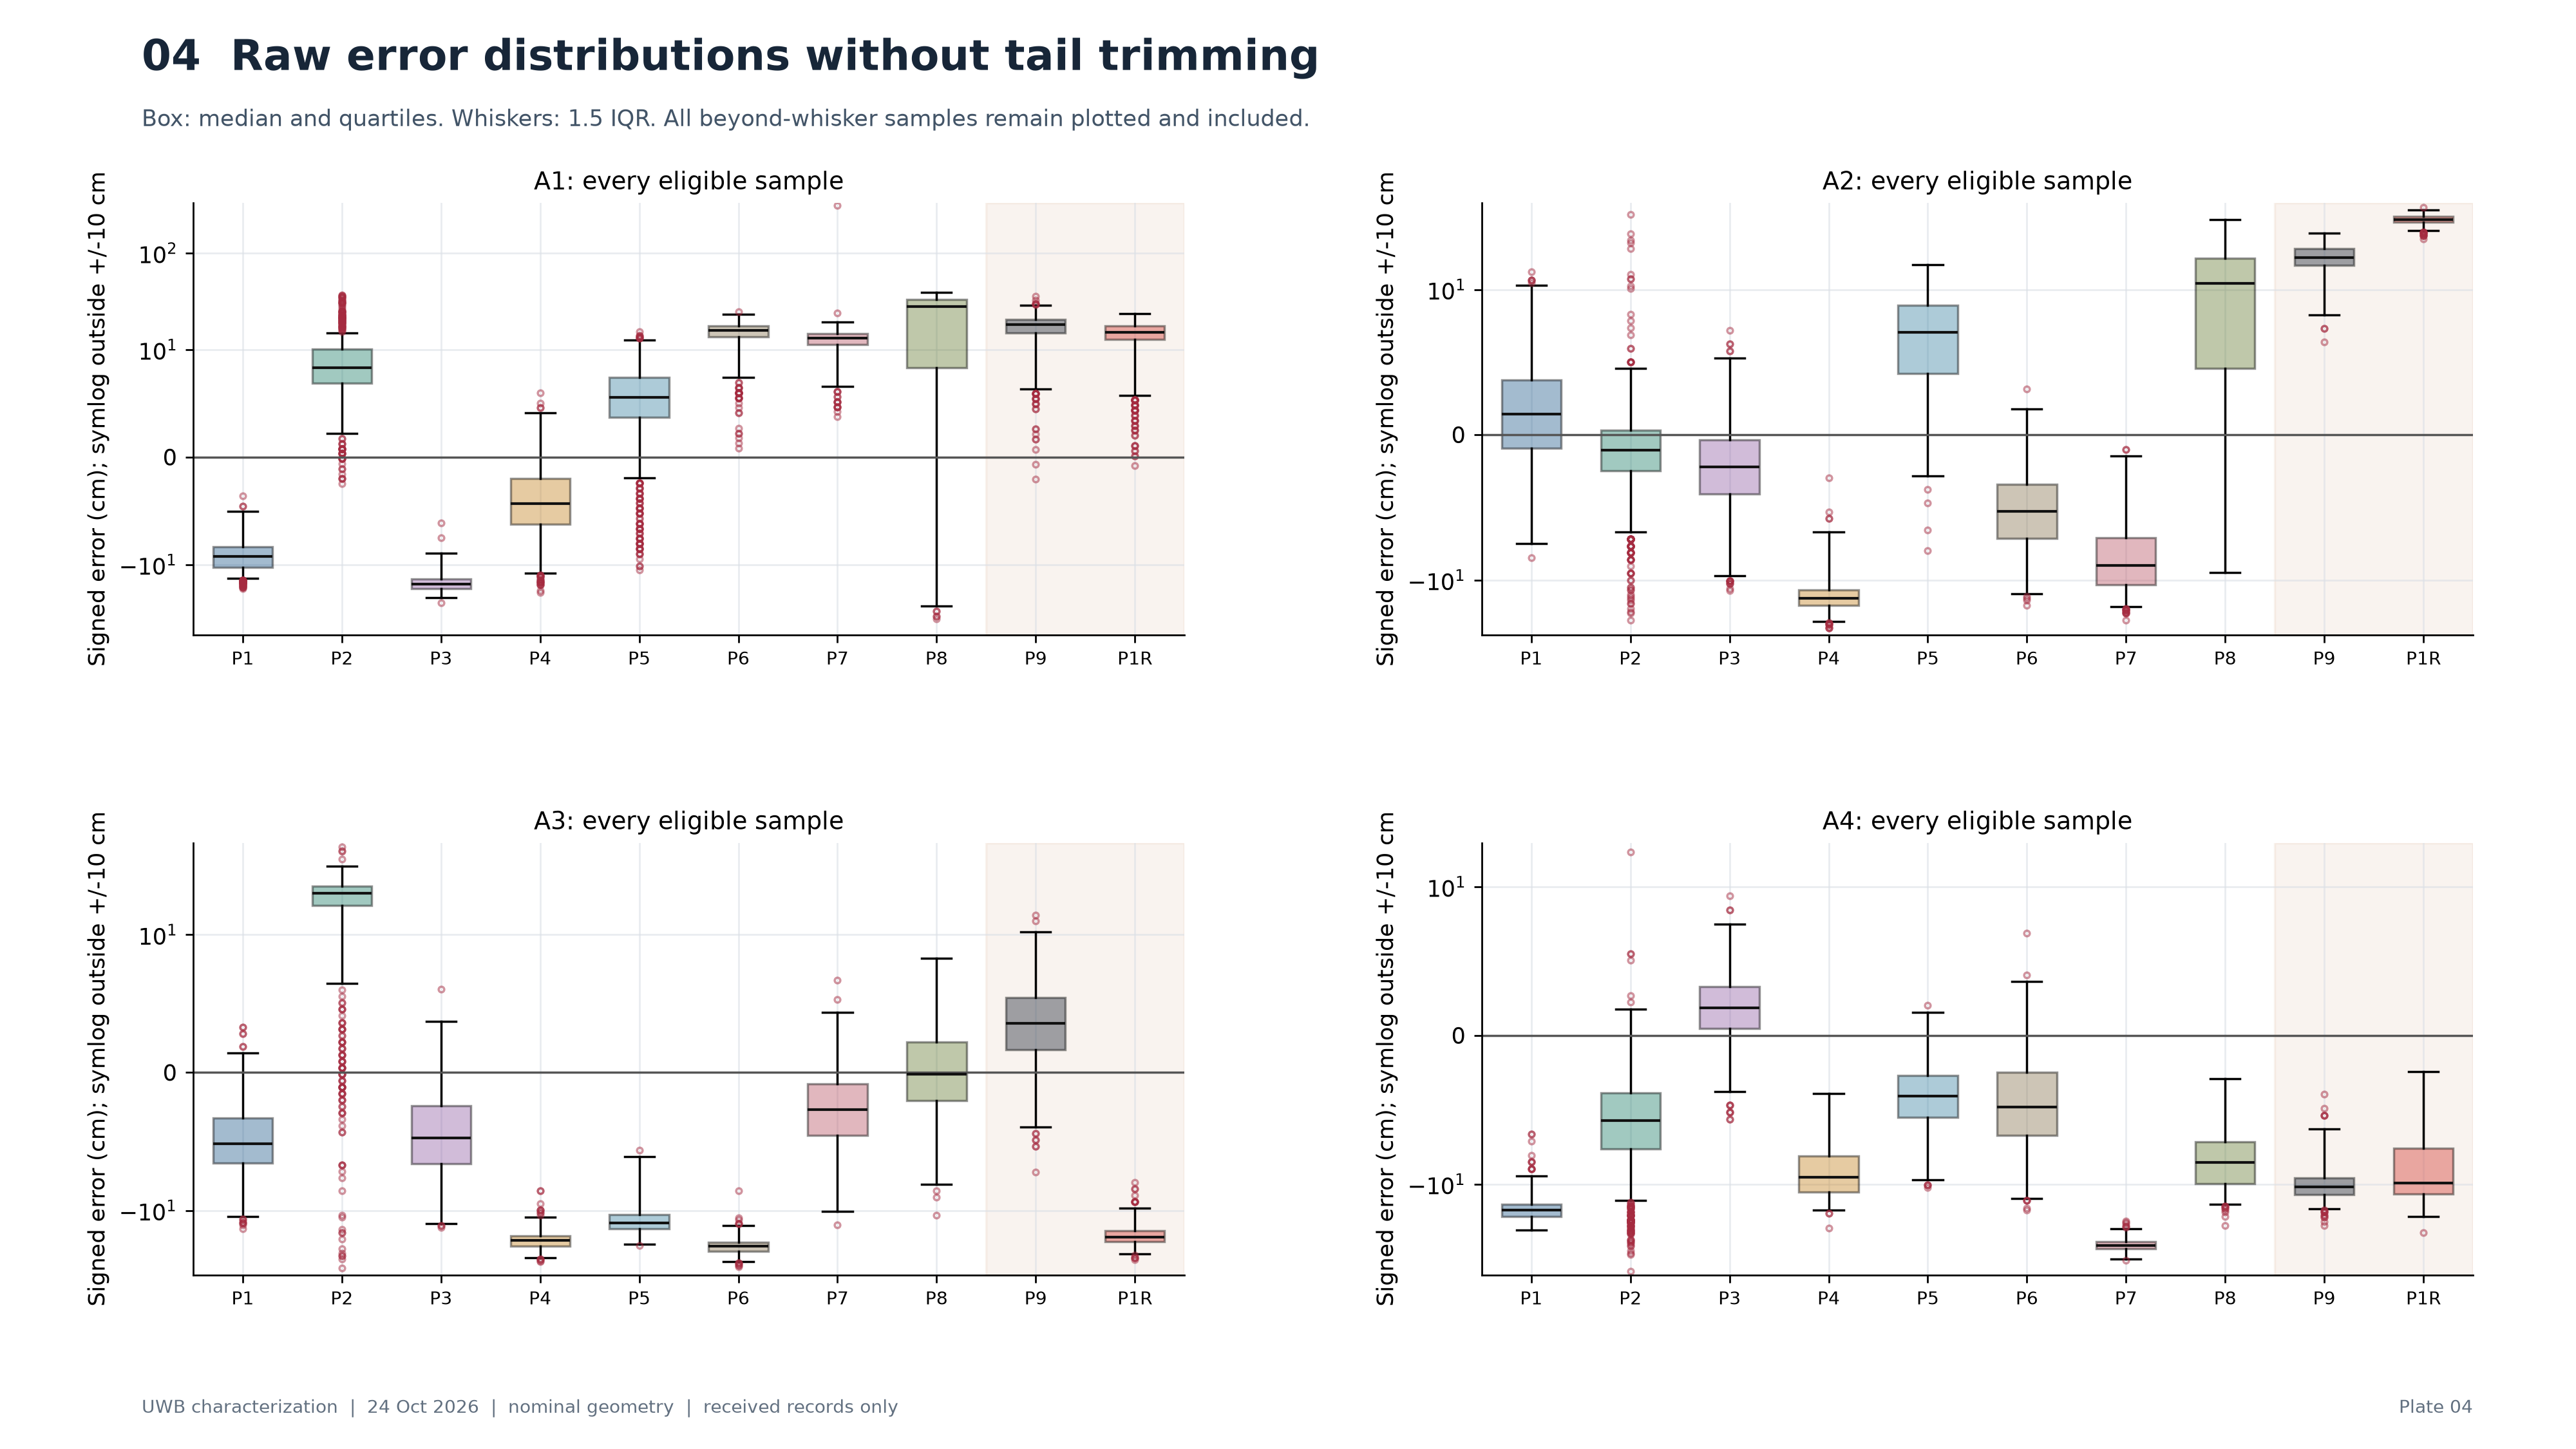
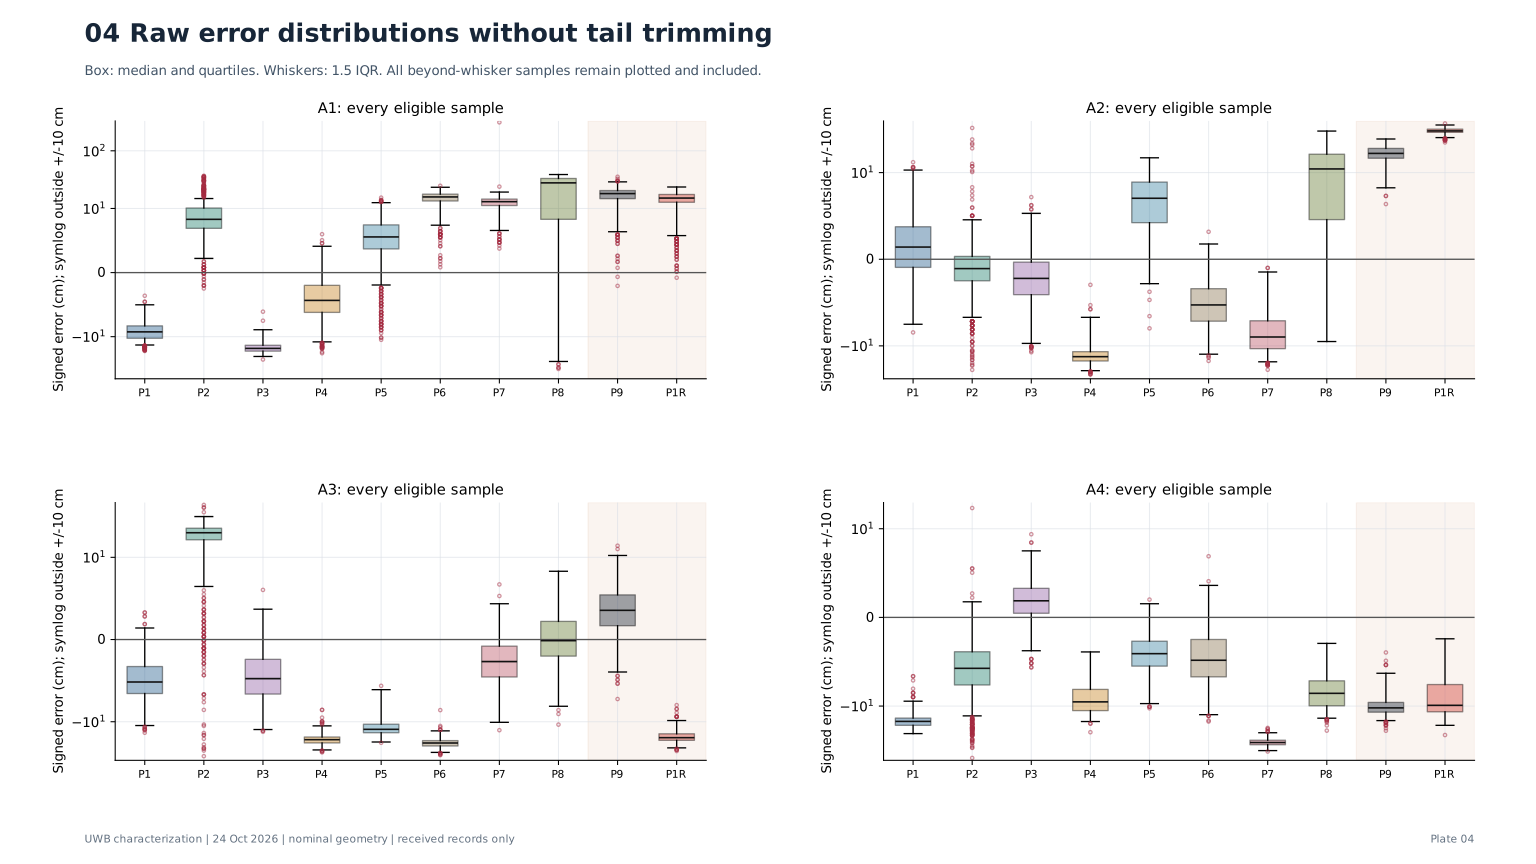
Raw error distributions without tail trimming
The symmetric logarithmic axis retains large errors while keeping the central region readable. The 1.5-IQR convention is visual only; it is not an exclusion rule.
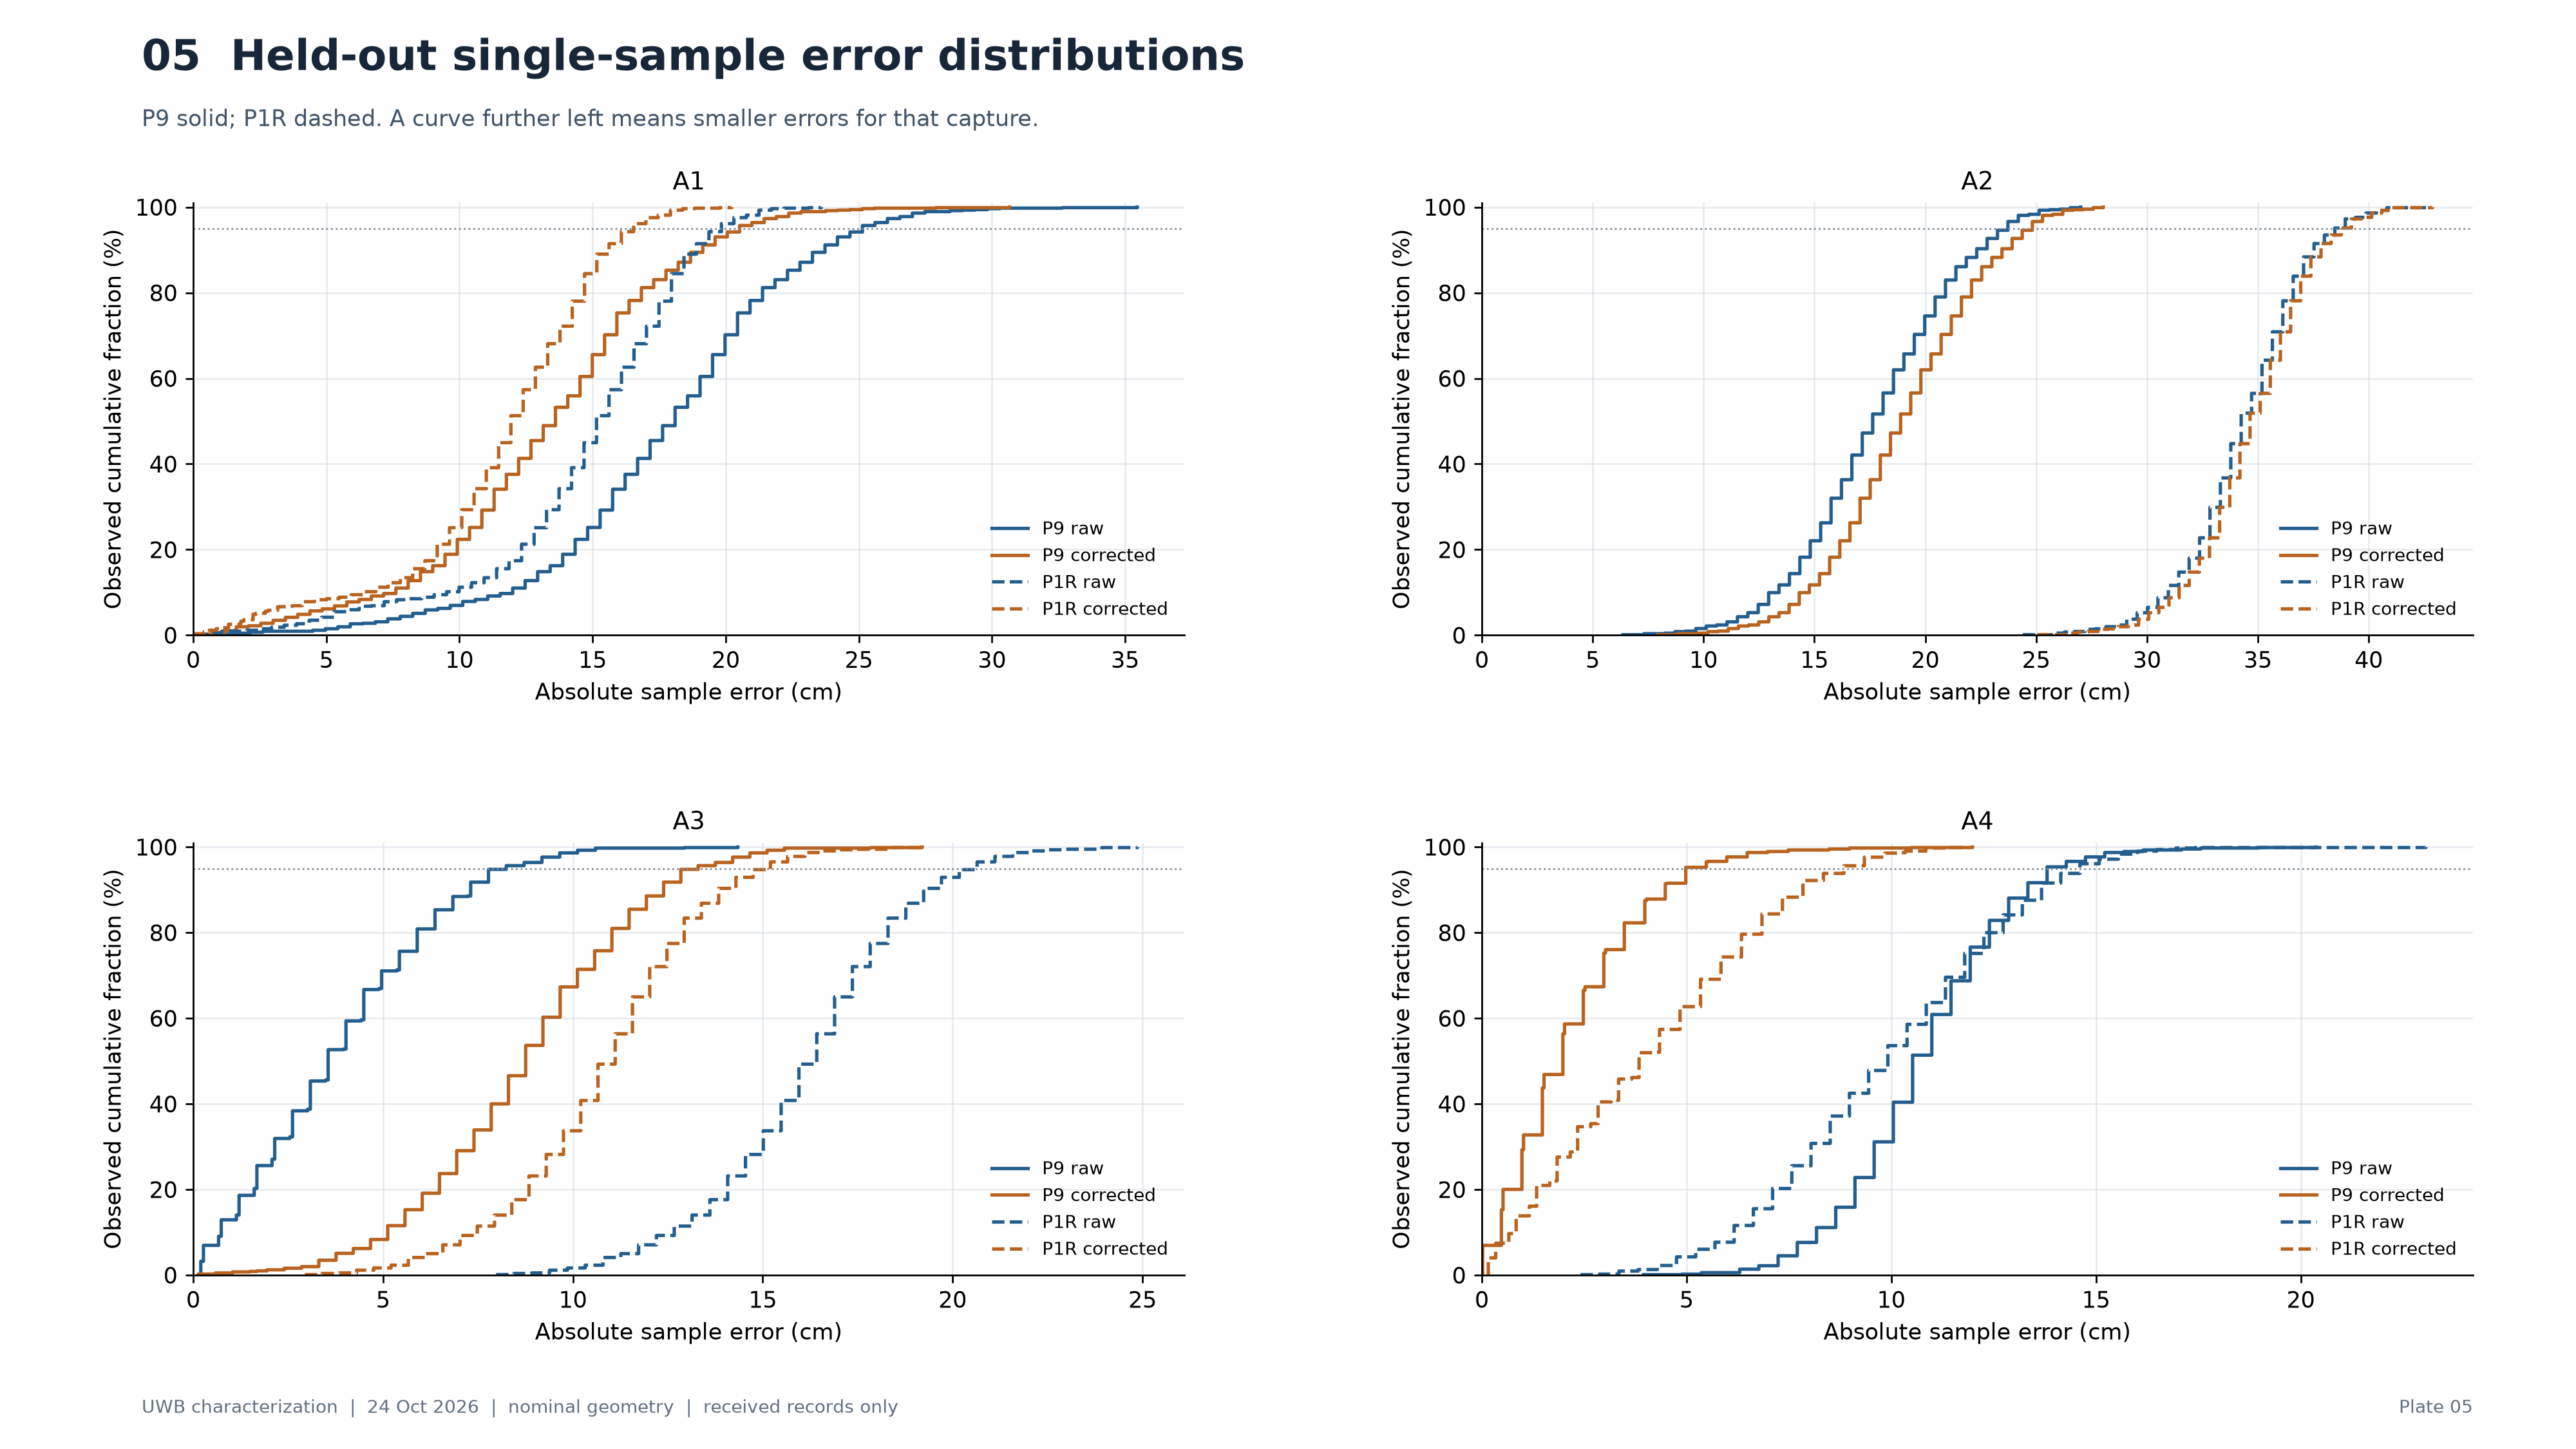
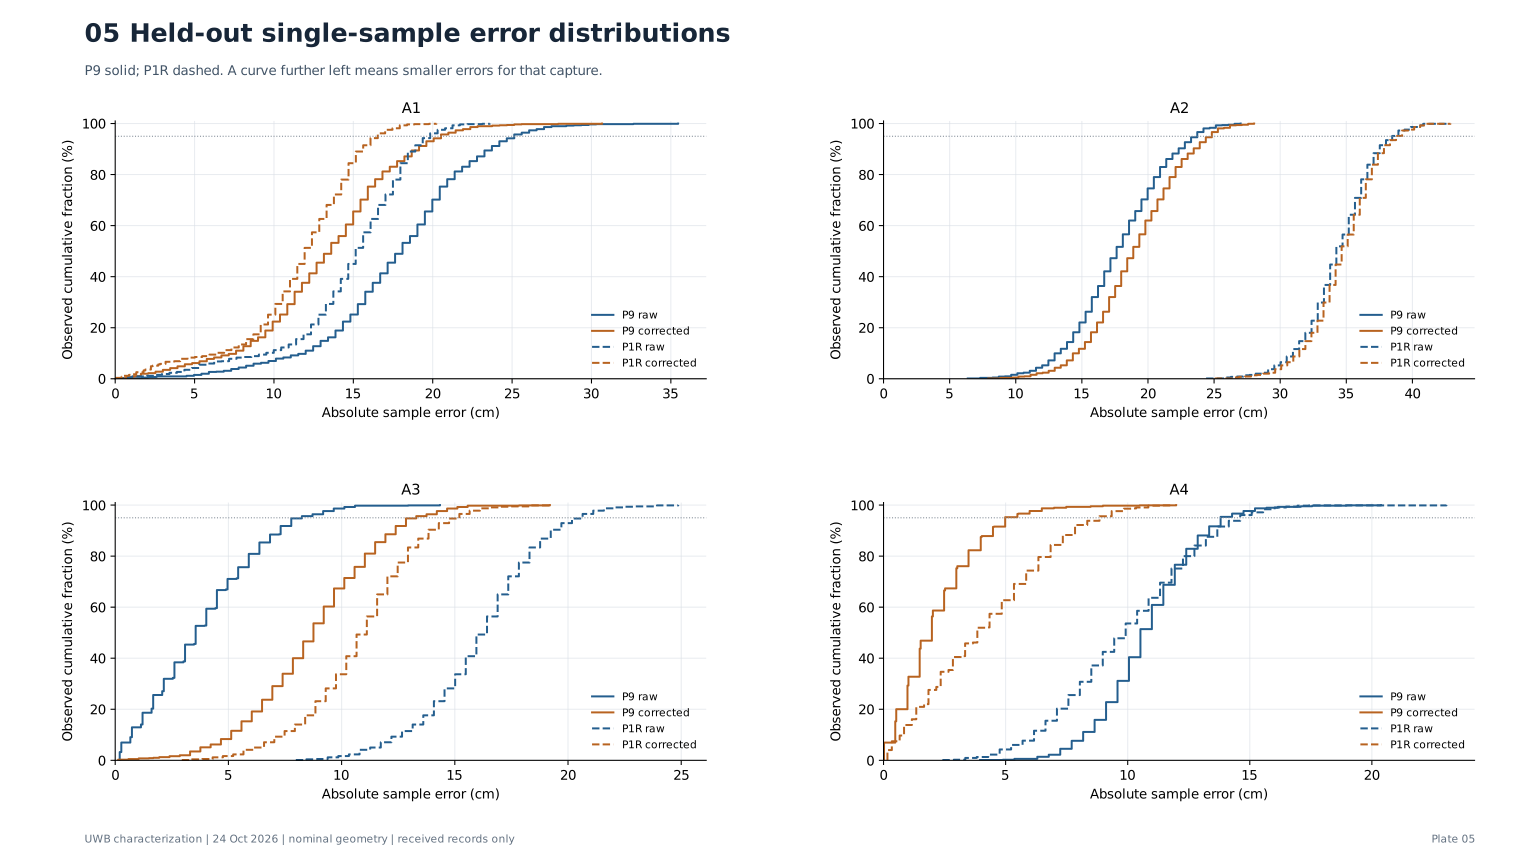
Held-out single-sample error distributions
Each CDF has its own empirical denominator. Samples are serially dependent and these curves are descriptive. No held-out data are used to refit or select a new correction.
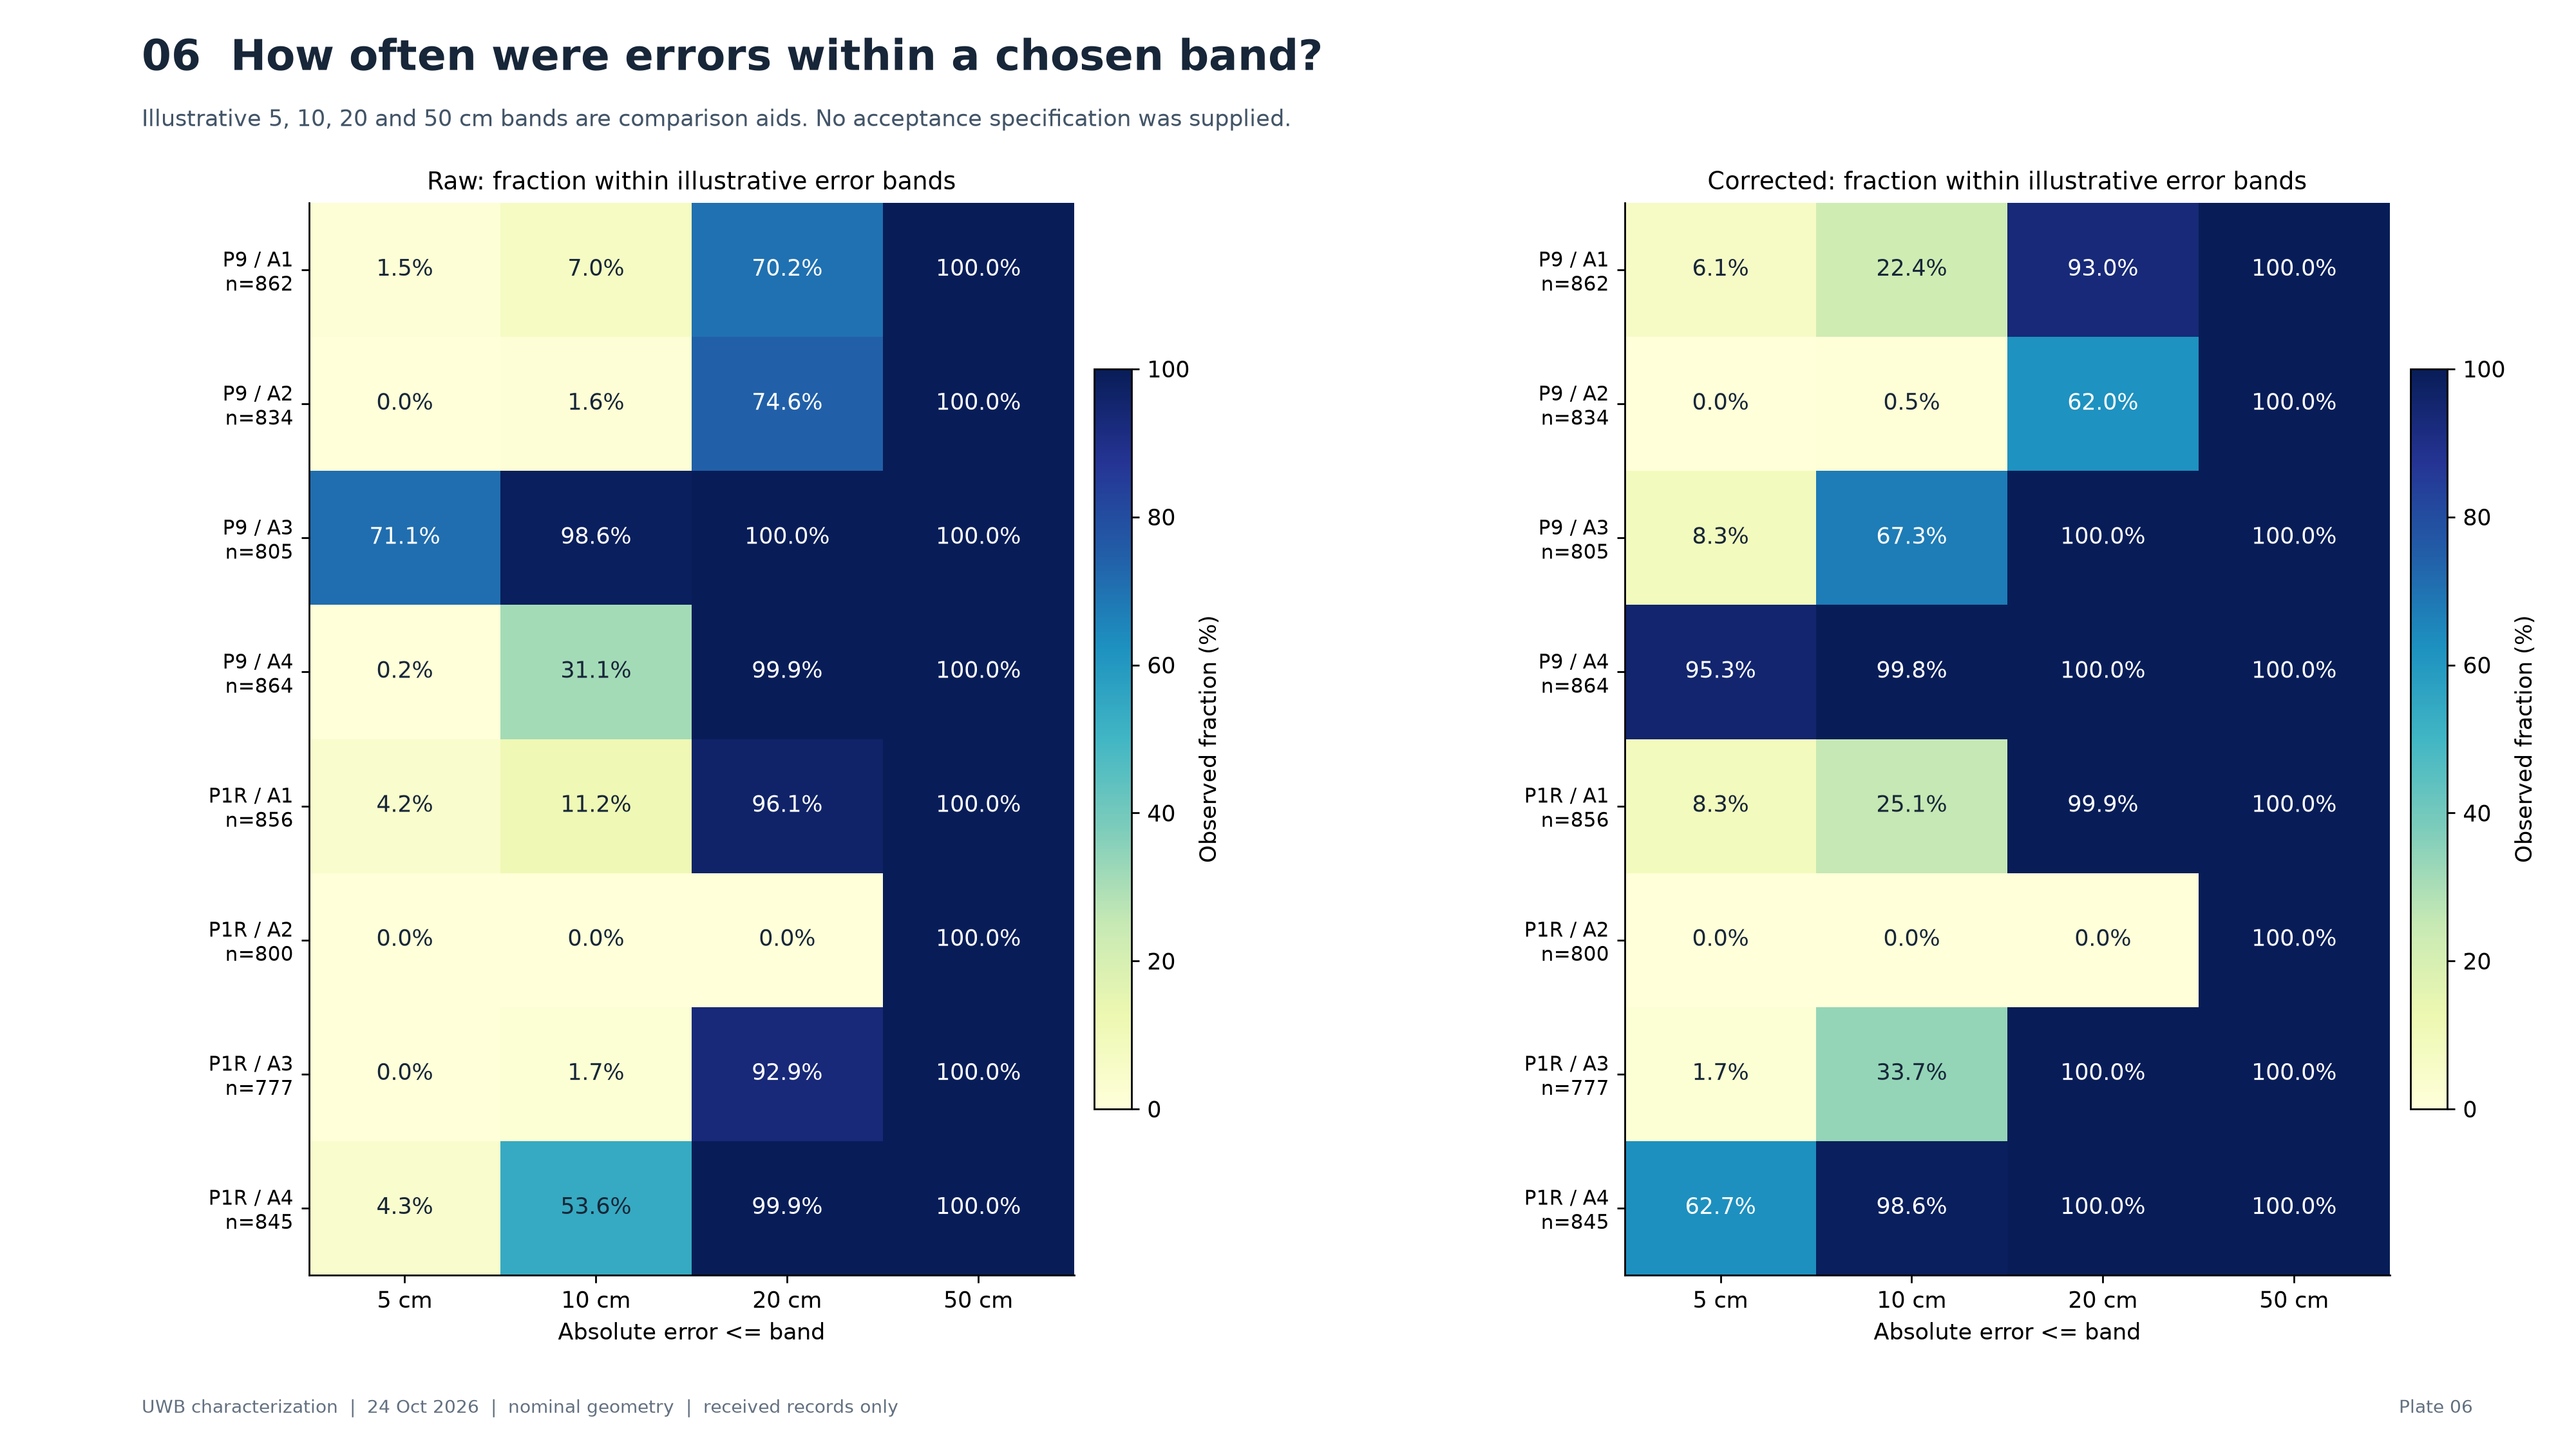
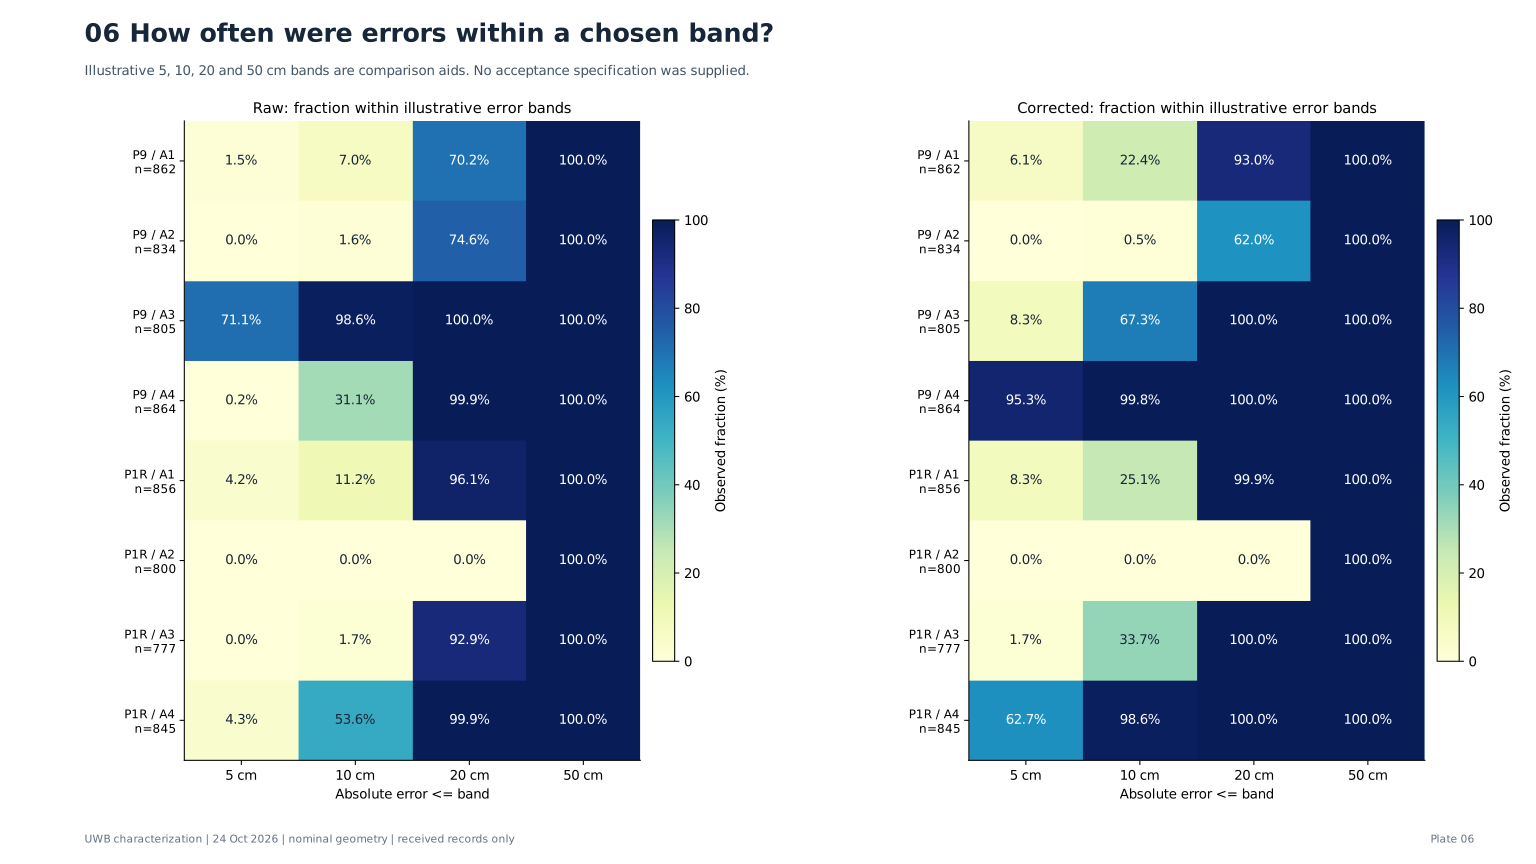
How often were errors within a chosen band?
Percentages are conditional on received canonical-valid unique ranges; they exclude invalid and unavailable measurements. They are not availability-adjusted success probabilities or safety guarantees.
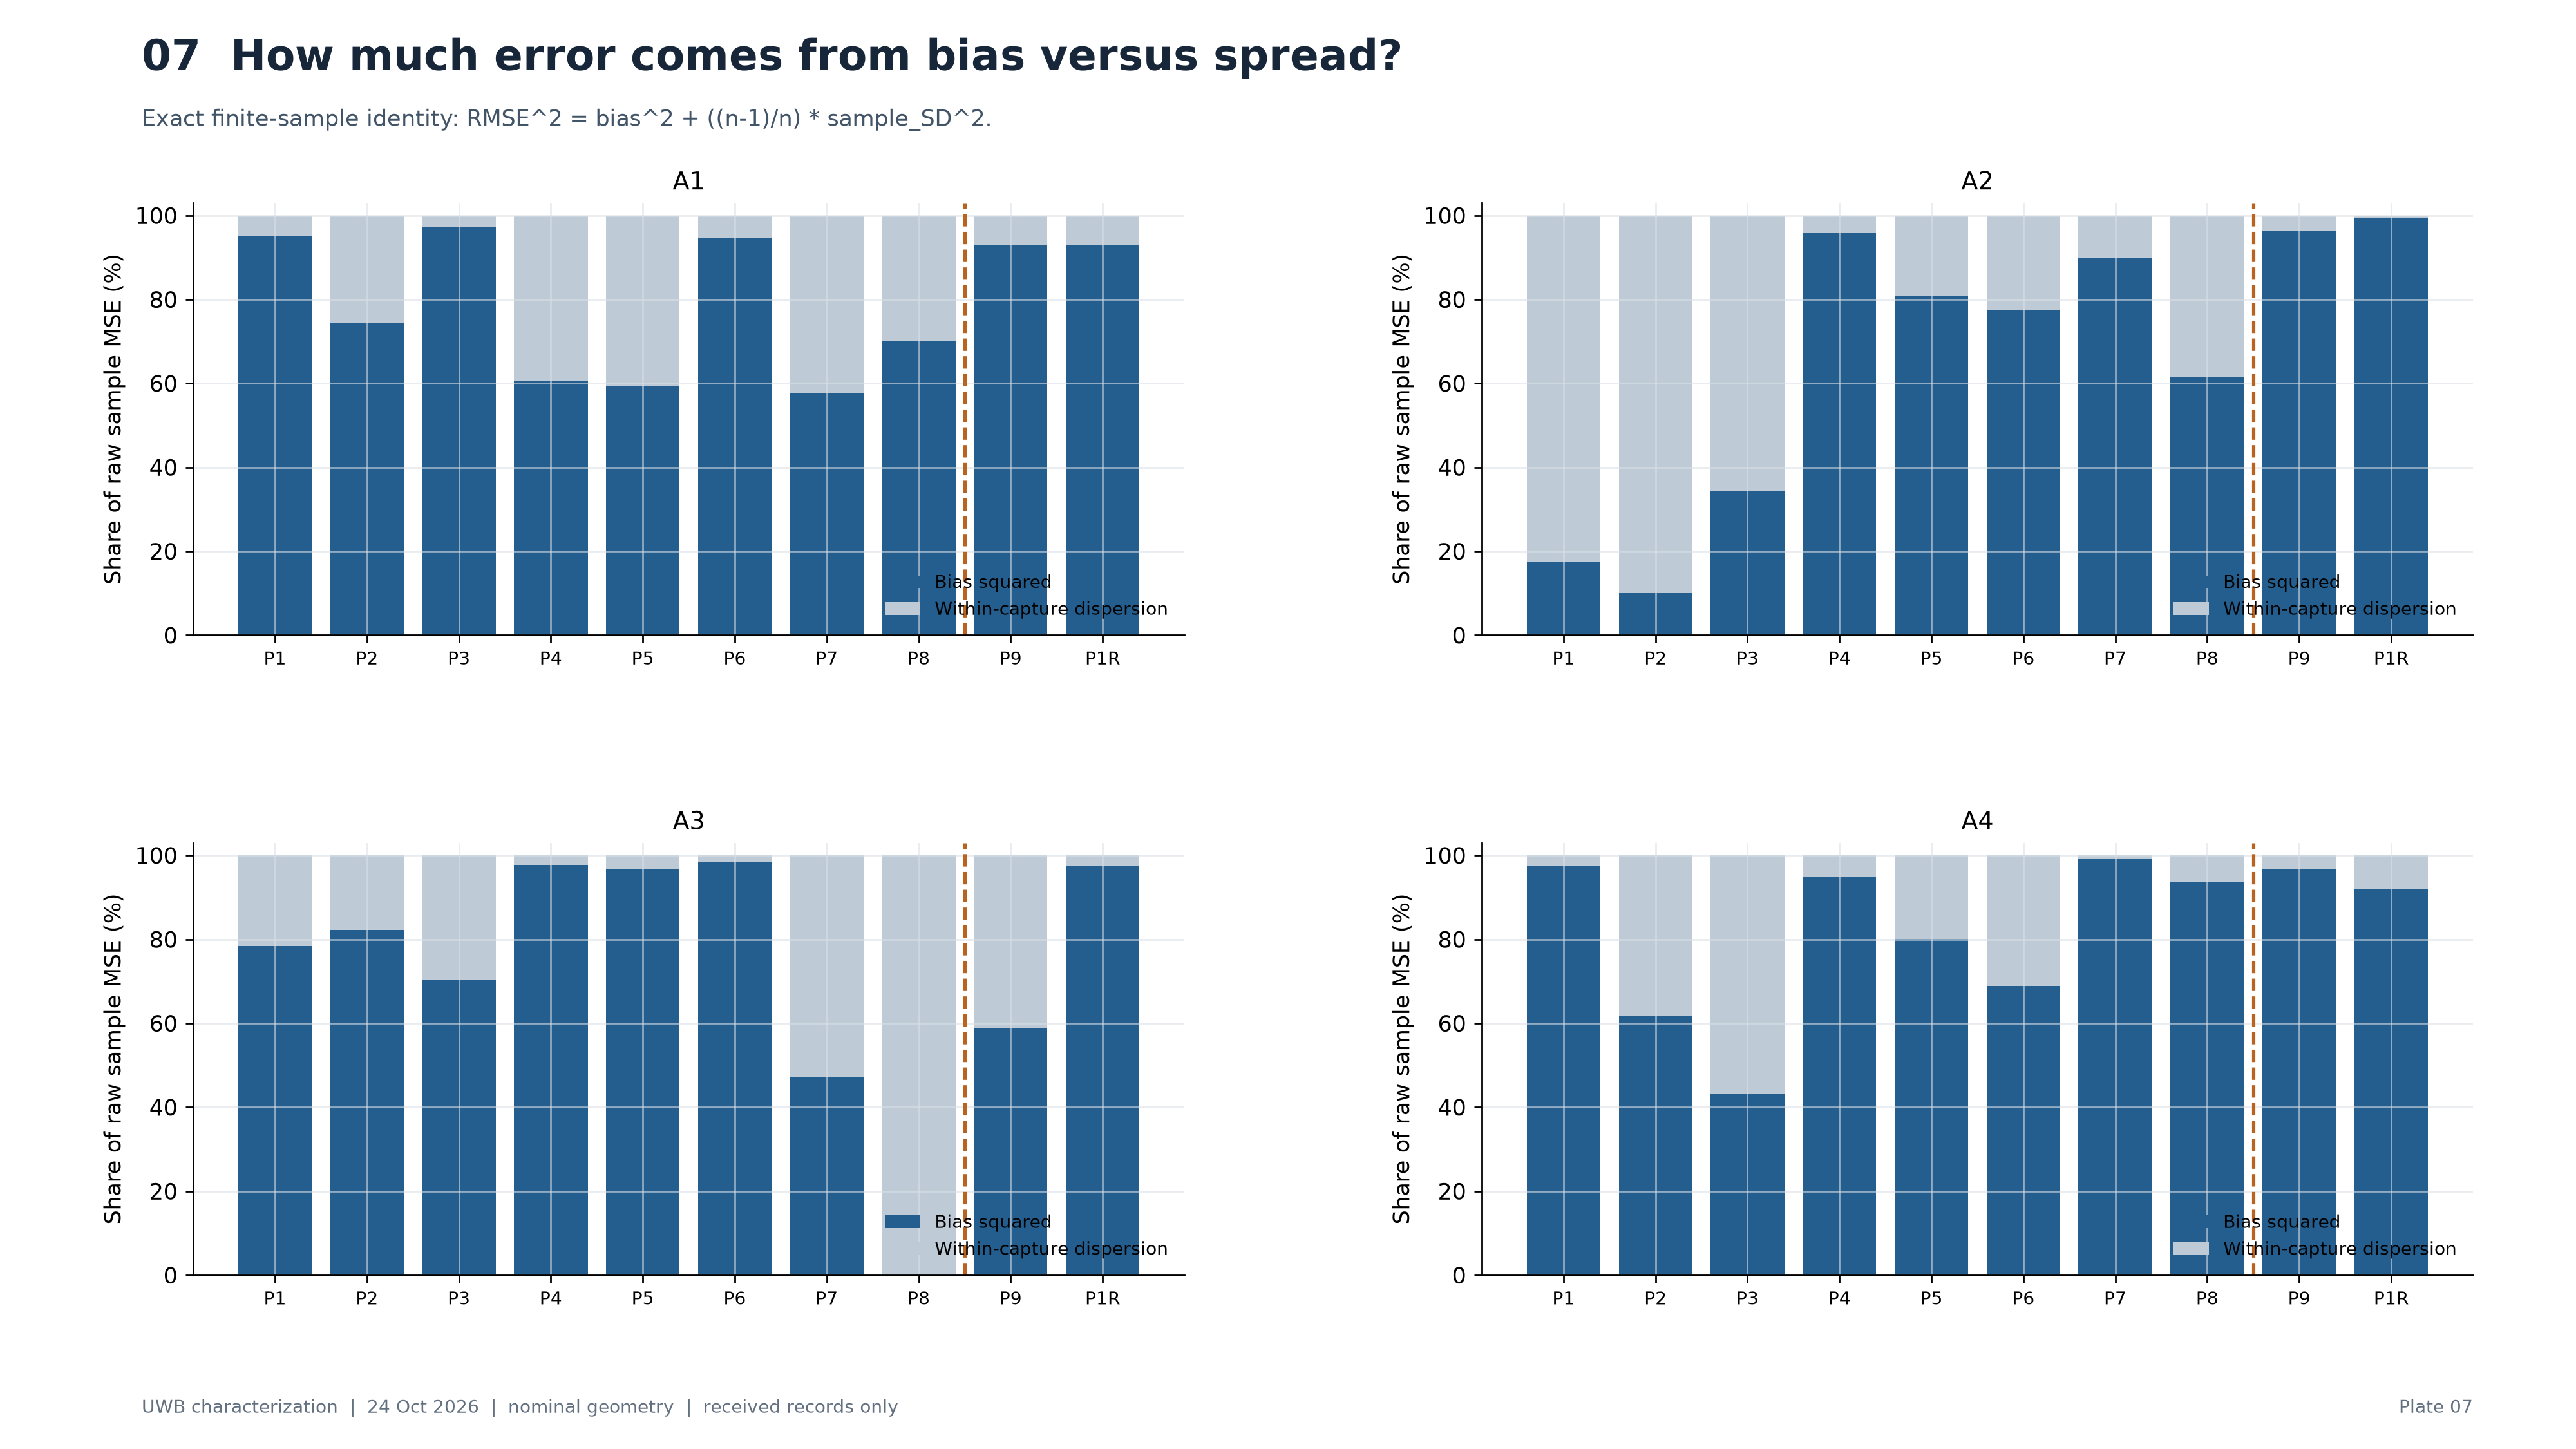
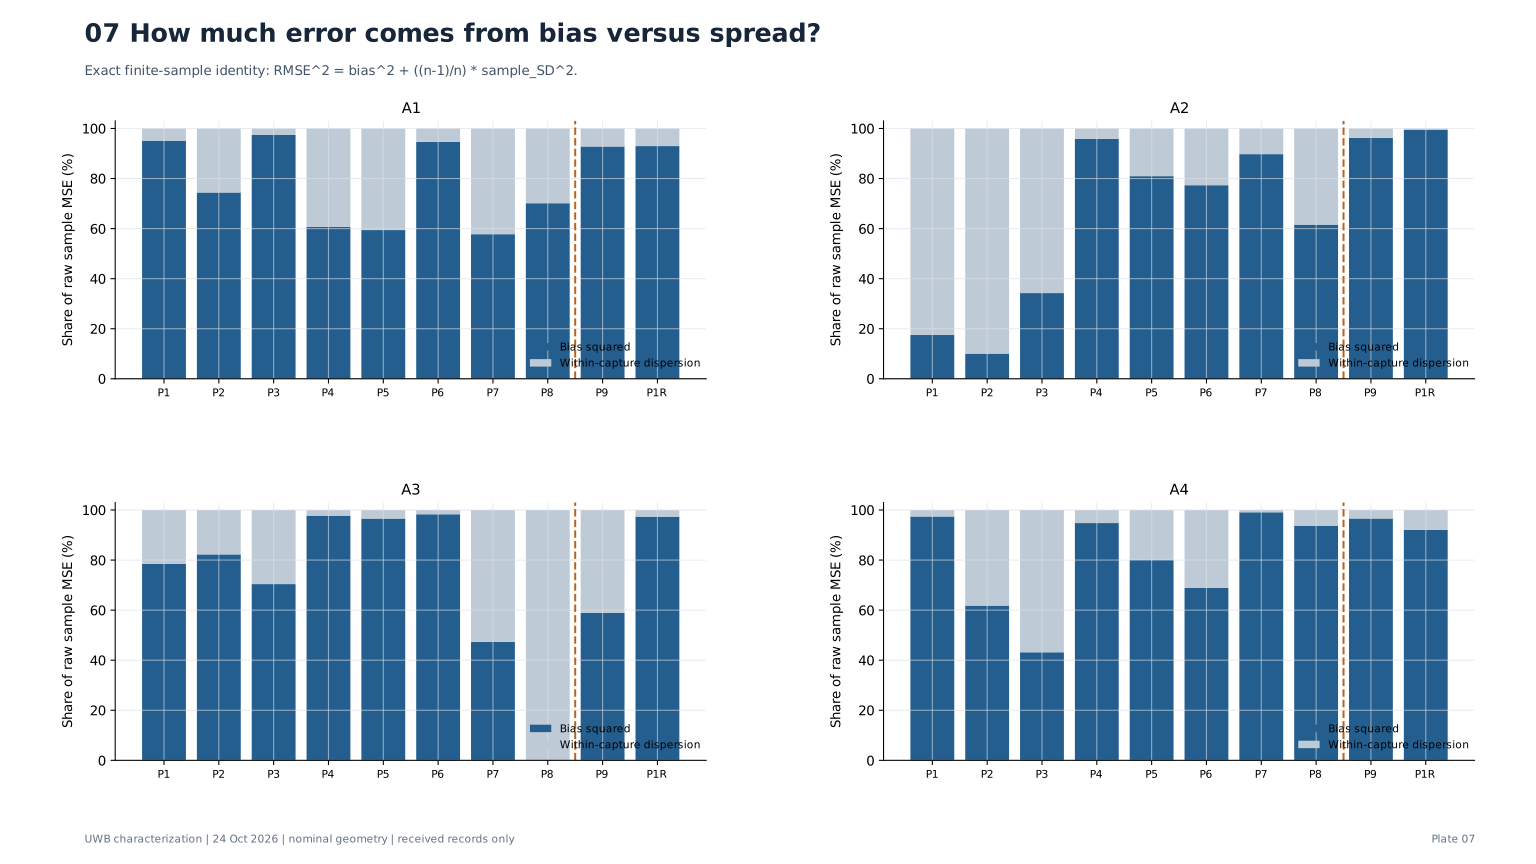
How much error comes from bias versus spread?
This is an algebraic decomposition against the nominal reference, not a causal partition of hardware errors. A large bias share explains why averaging alone may leave substantial offset.
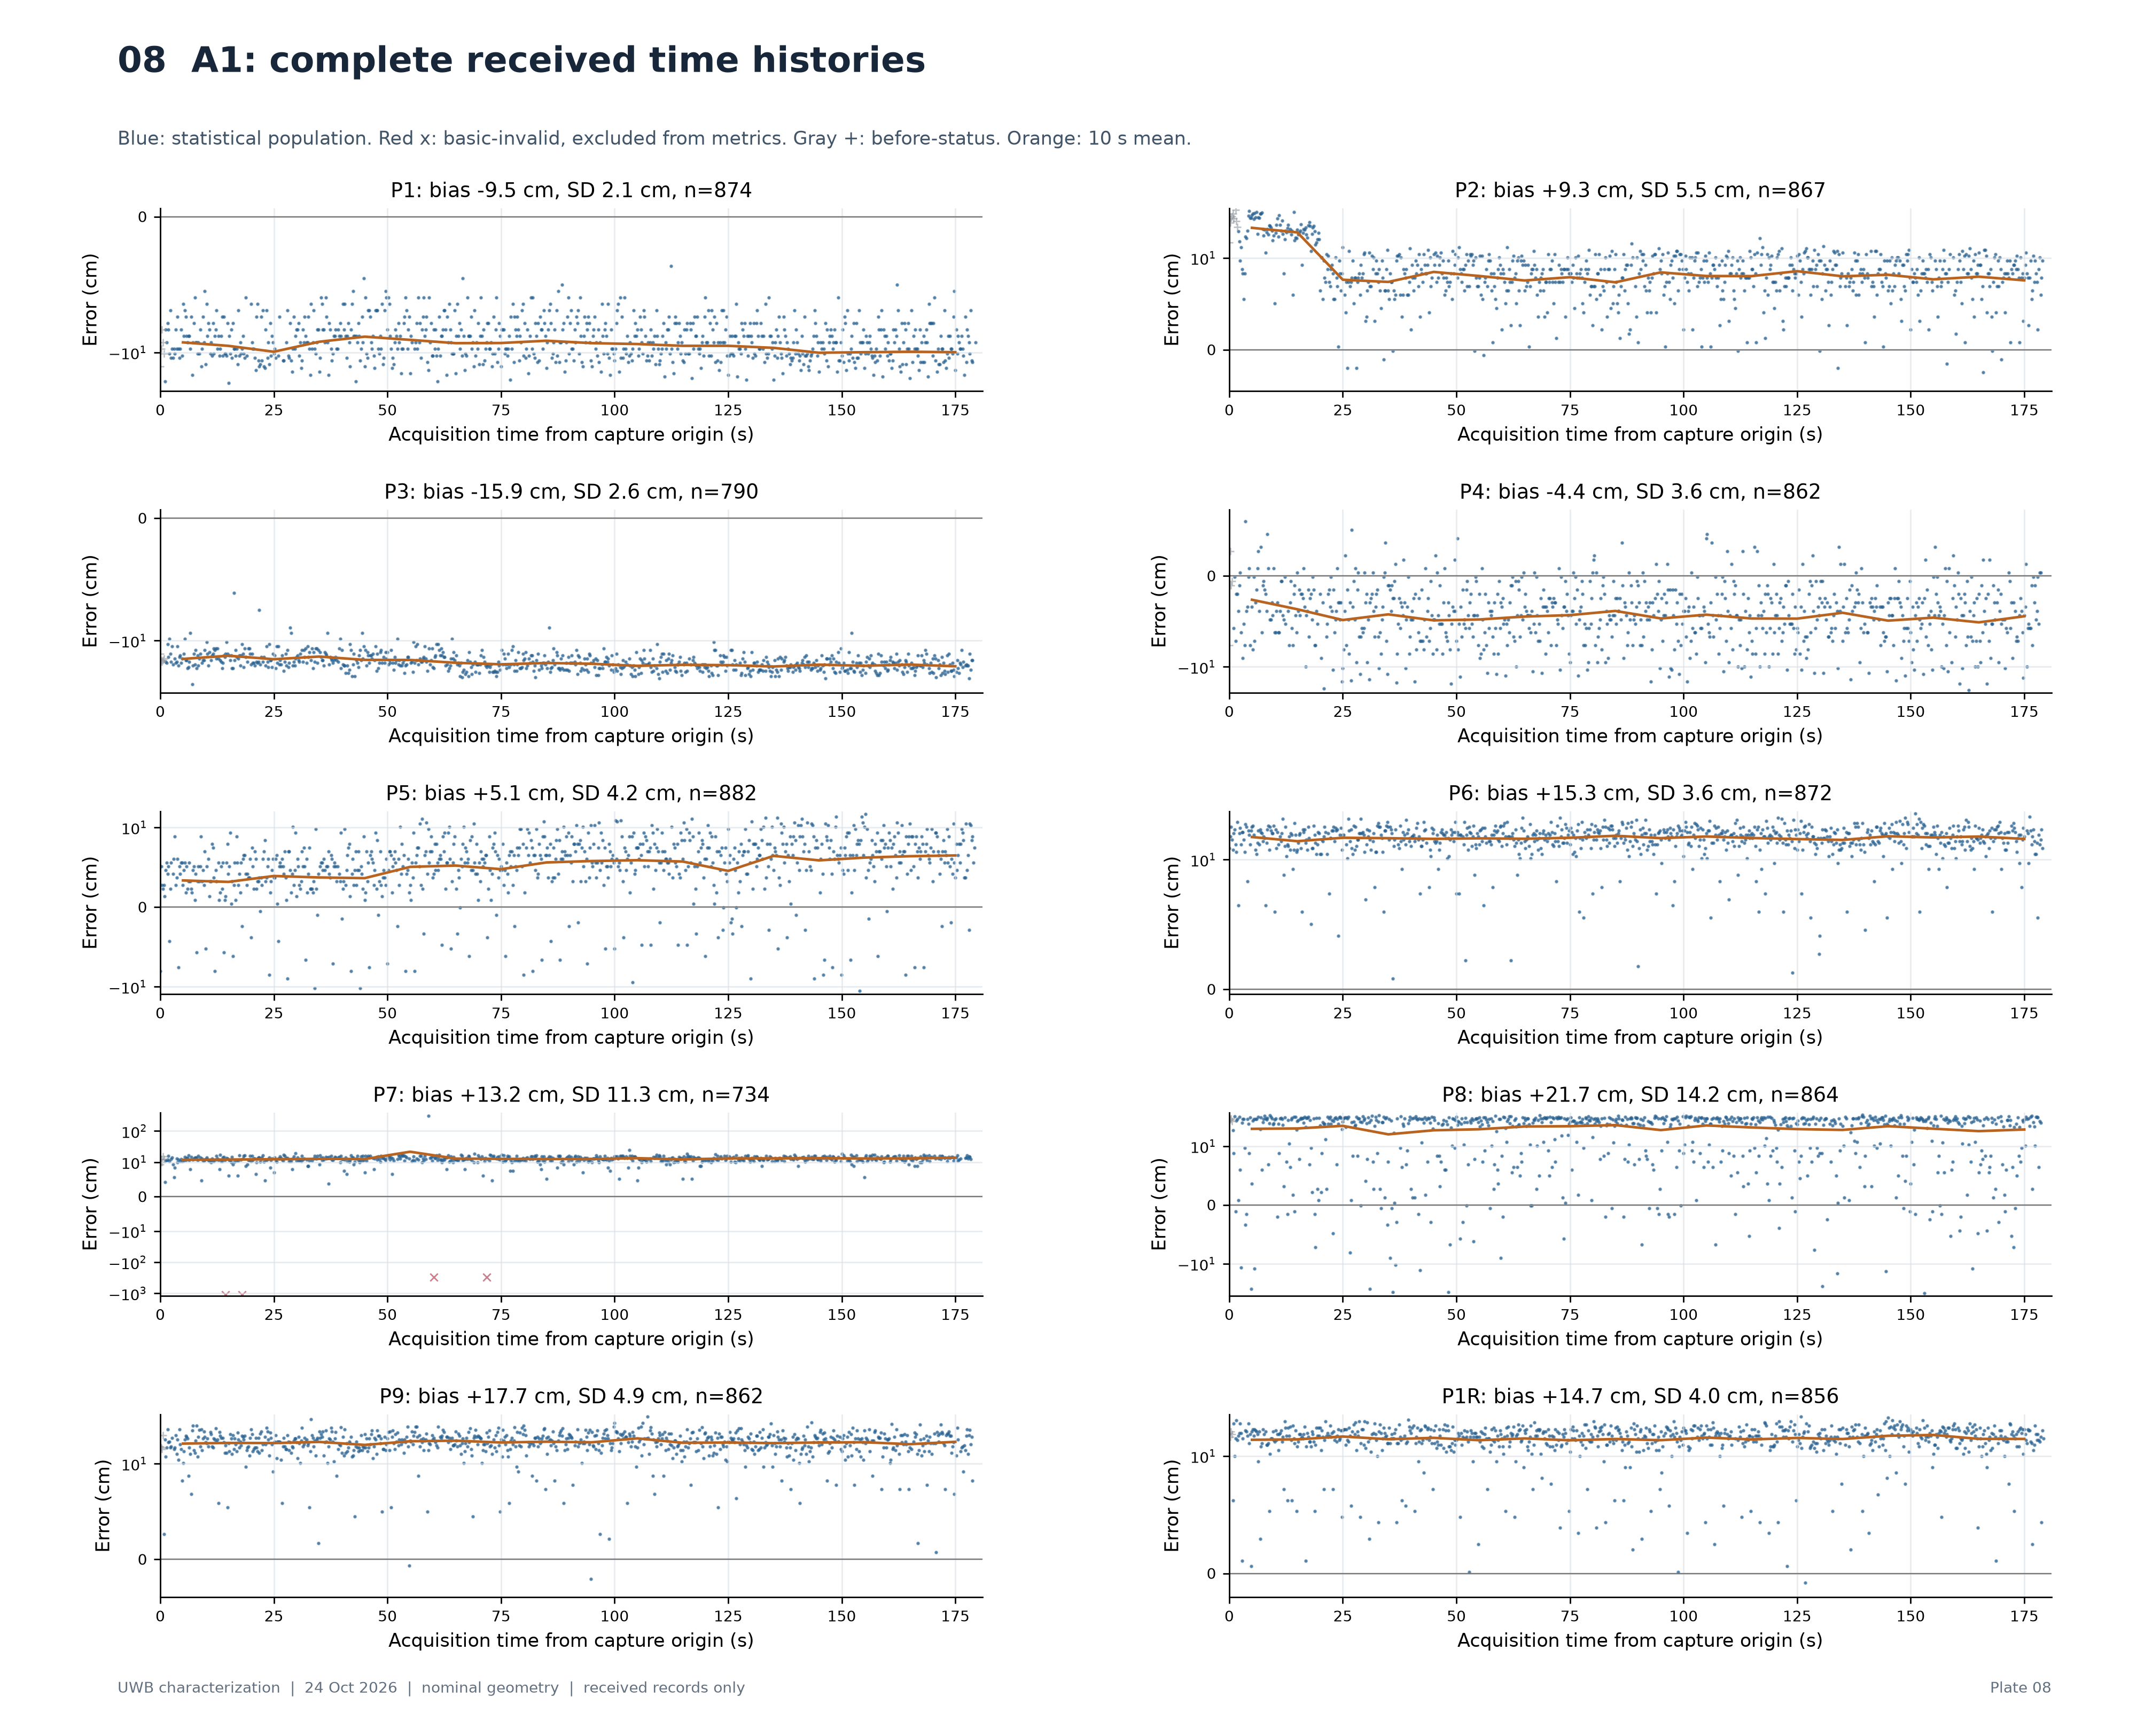
A1: complete received time histories
Times use tag acquisition clocks within each capture. No samples are interpolated. Panels use symlog axes and individual limits. Orange bins summarize existing samples and do not reconstruct missing data.
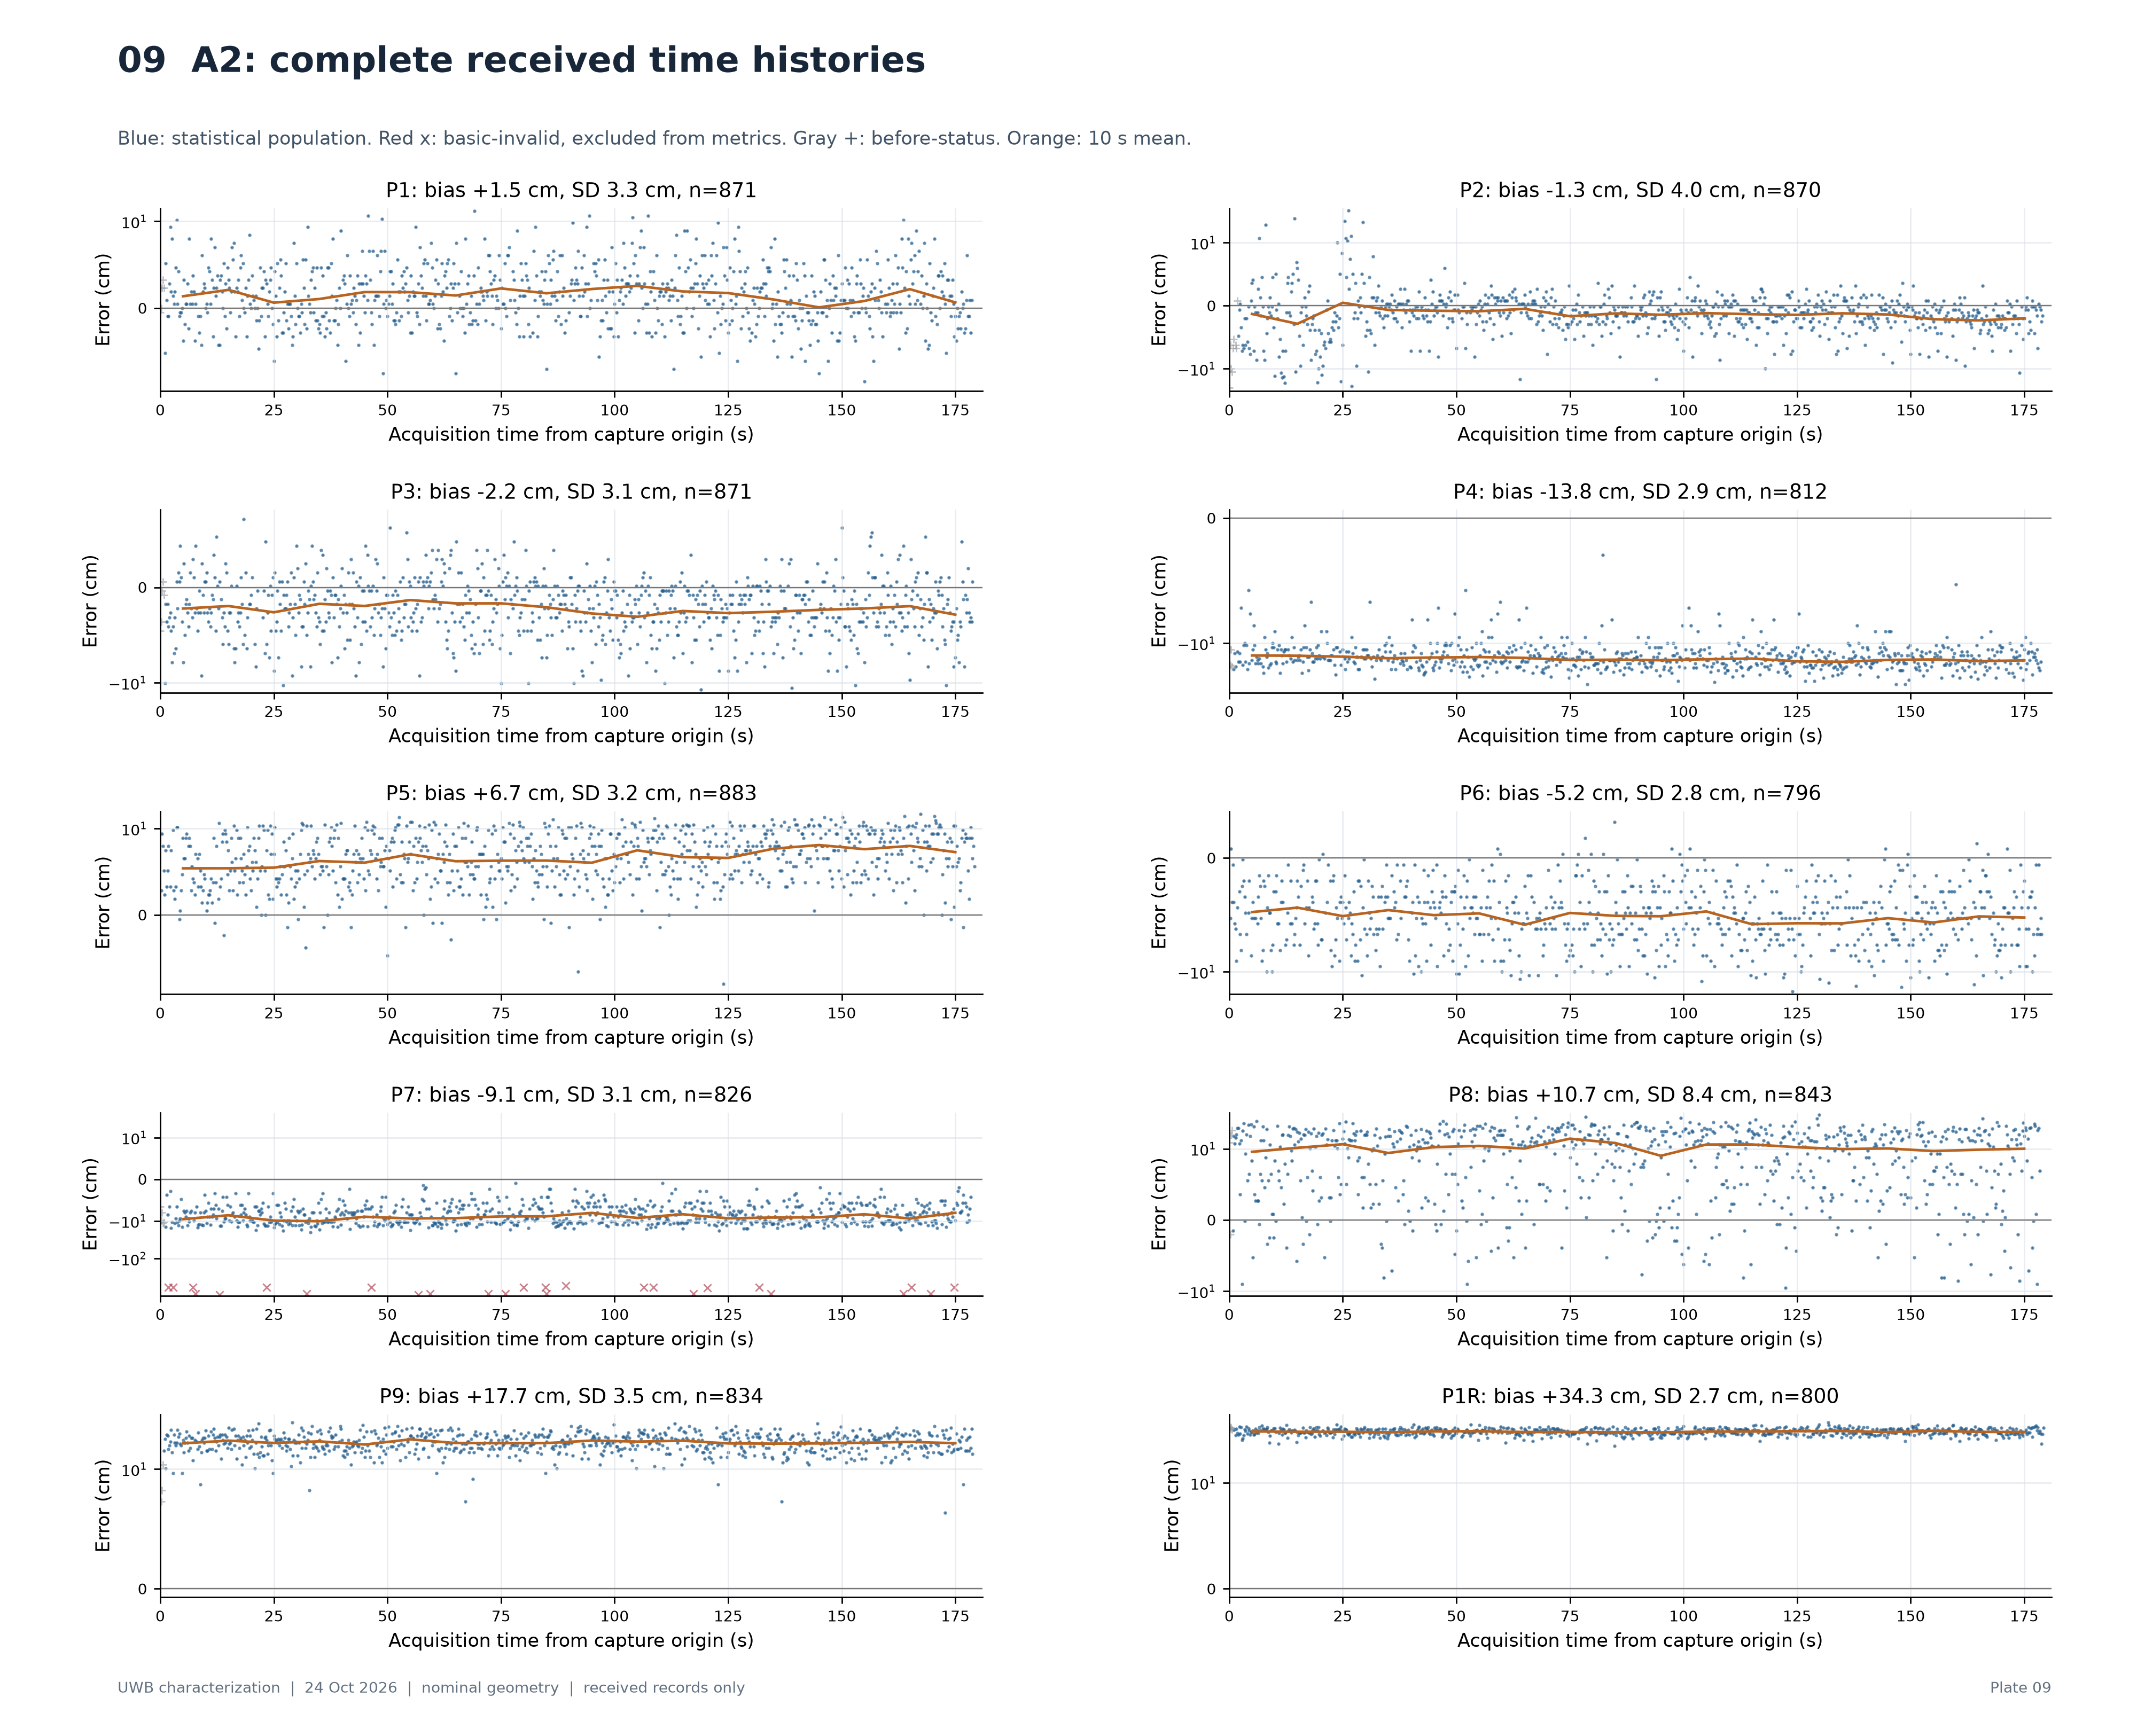
A2: complete received time histories
Times use tag acquisition clocks within each capture. No samples are interpolated. Panels use symlog axes and individual limits. Orange bins summarize existing samples and do not reconstruct missing data.
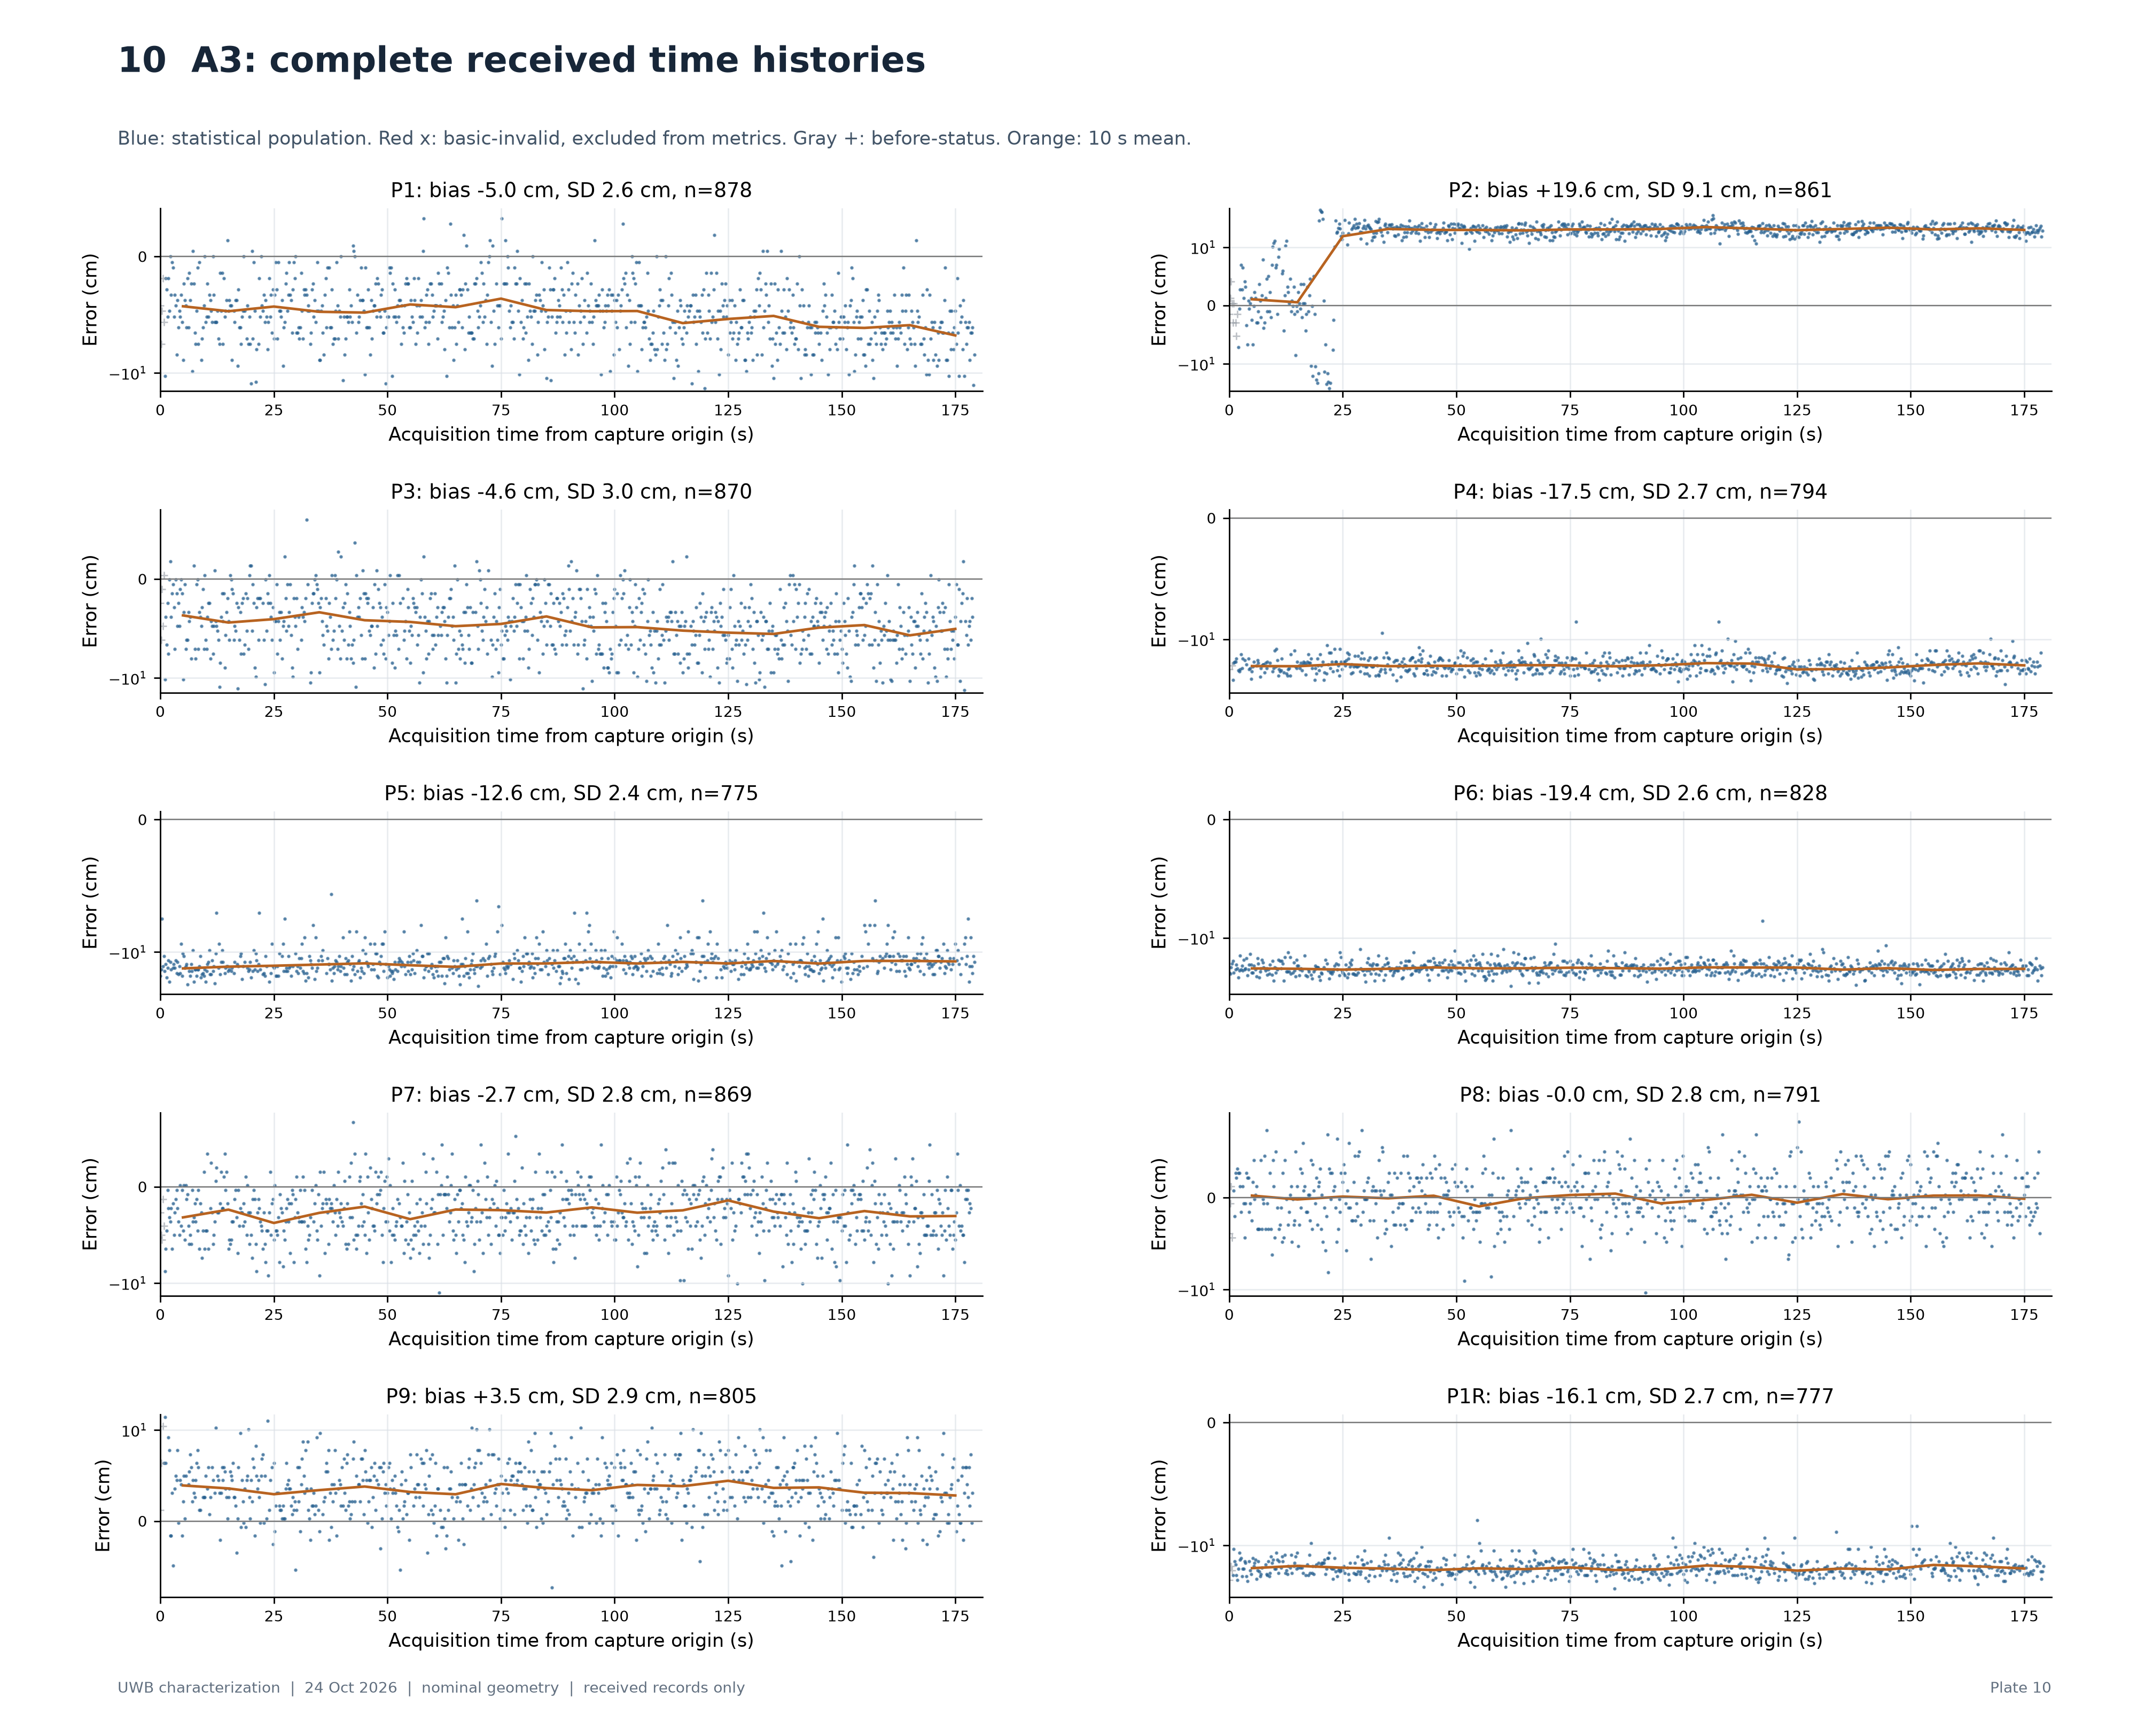
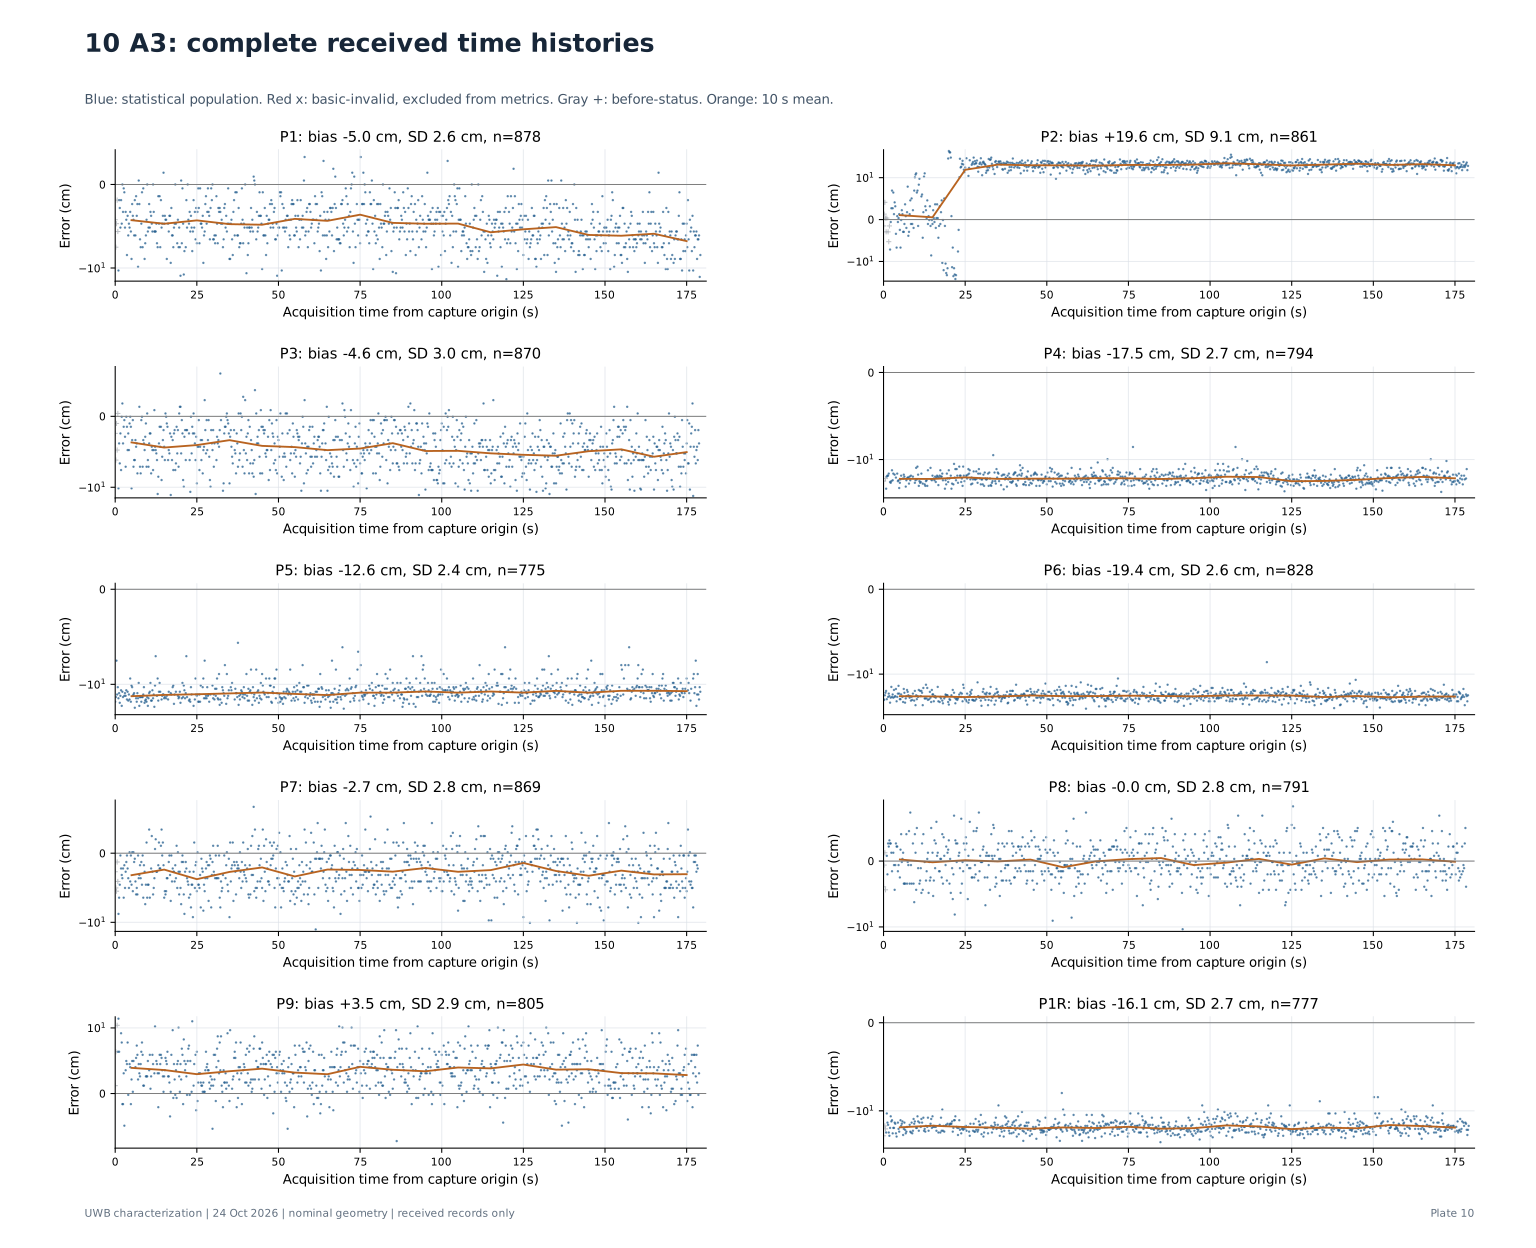
A3: complete received time histories
Times use tag acquisition clocks within each capture. No samples are interpolated. Panels use symlog axes and individual limits. Orange bins summarize existing samples and do not reconstruct missing data.
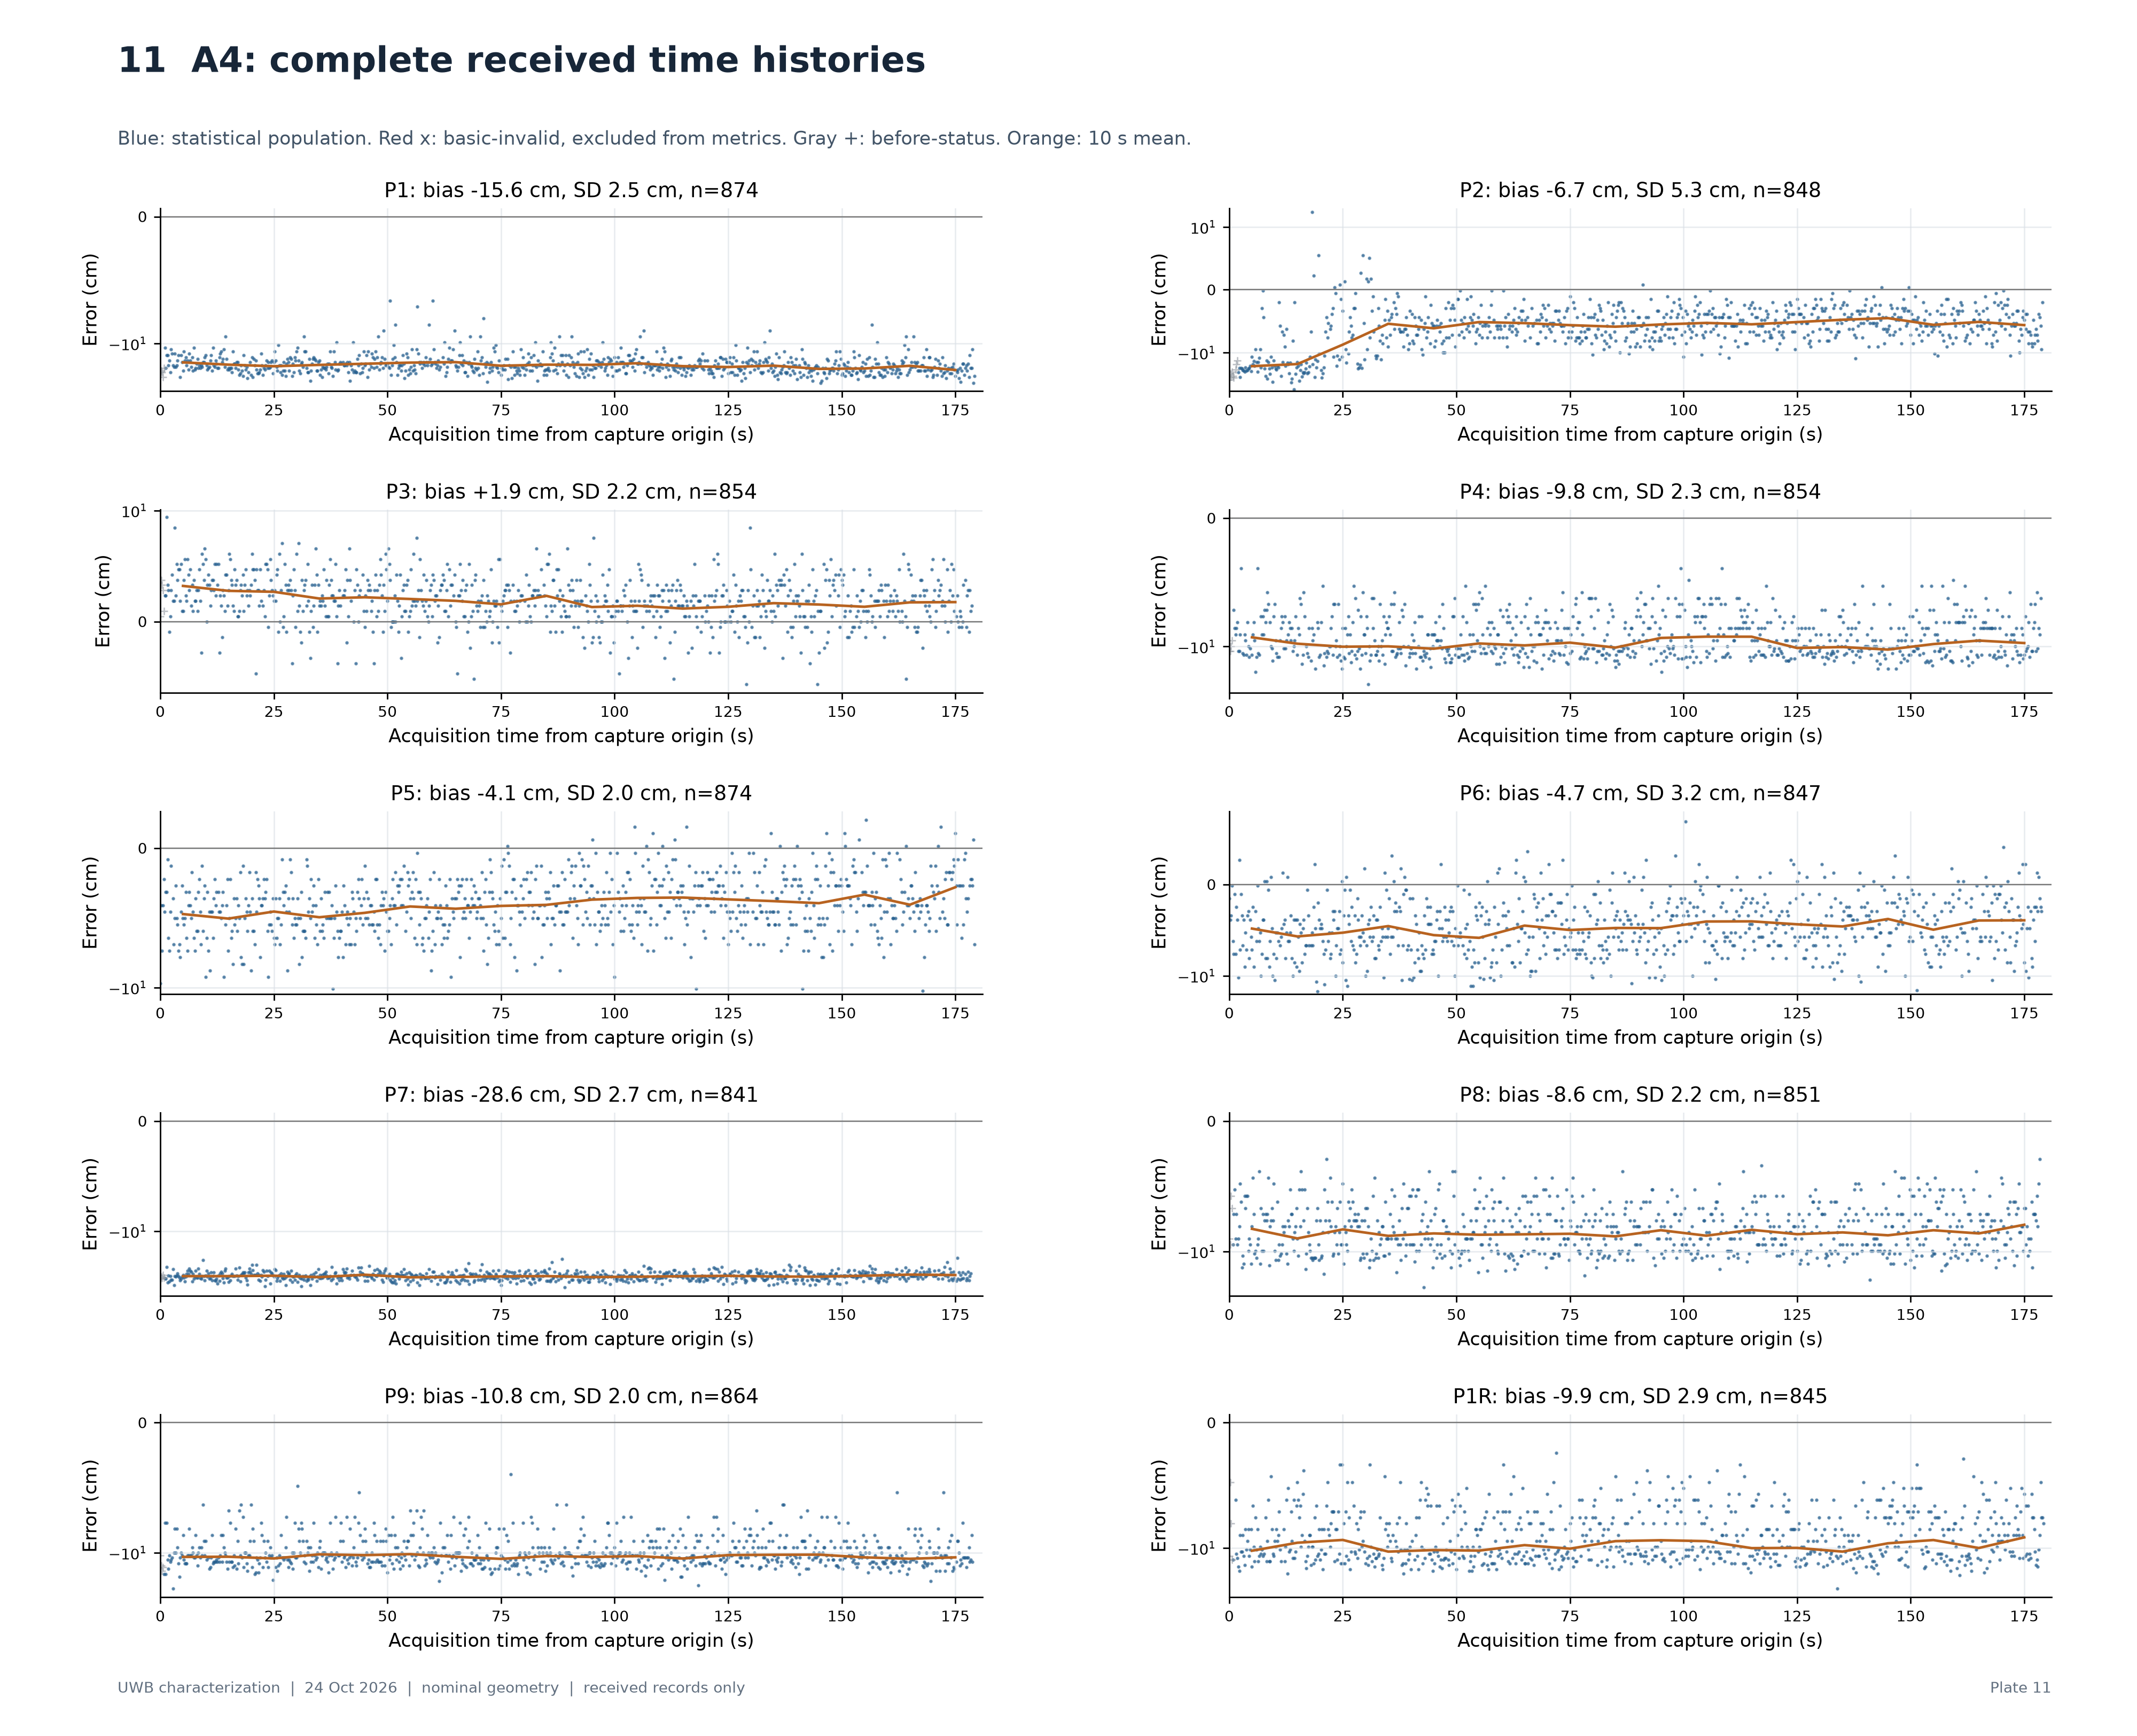
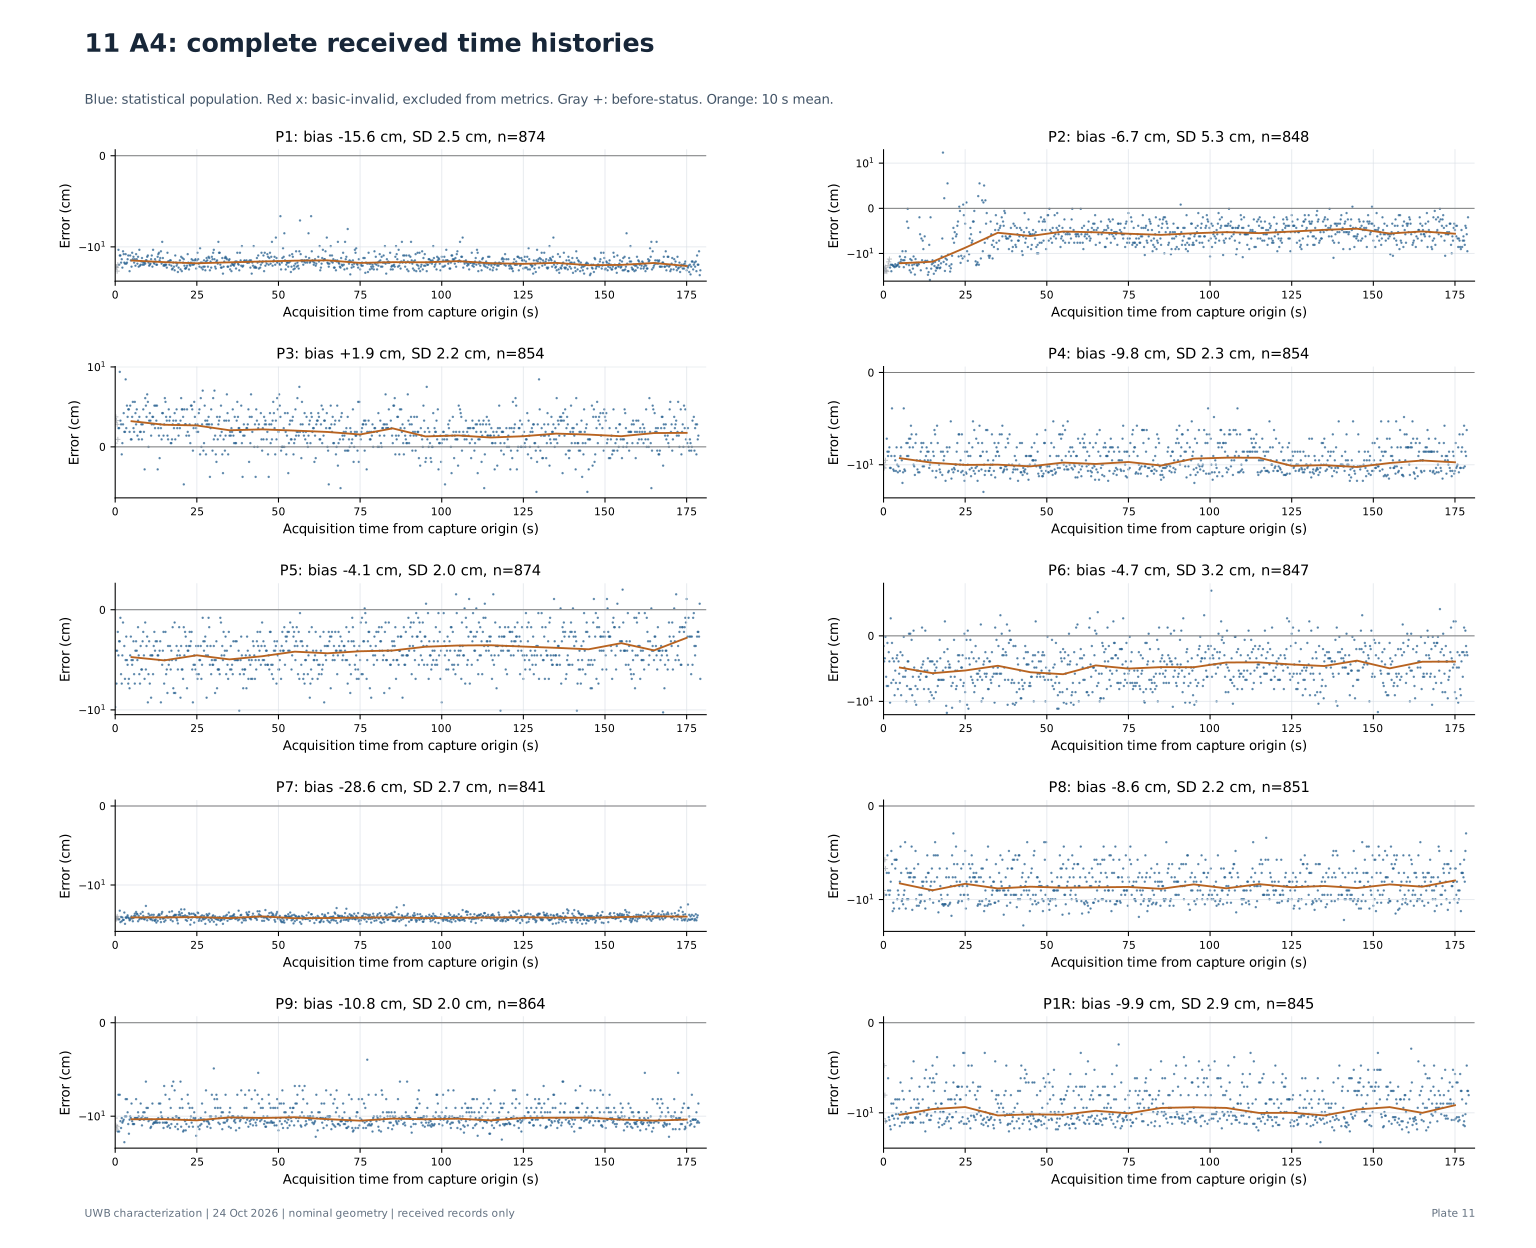
A4: complete received time histories
Times use tag acquisition clocks within each capture. No samples are interpolated. Panels use symlog axes and individual limits. Orange bins summarize existing samples and do not reconstruct missing data.
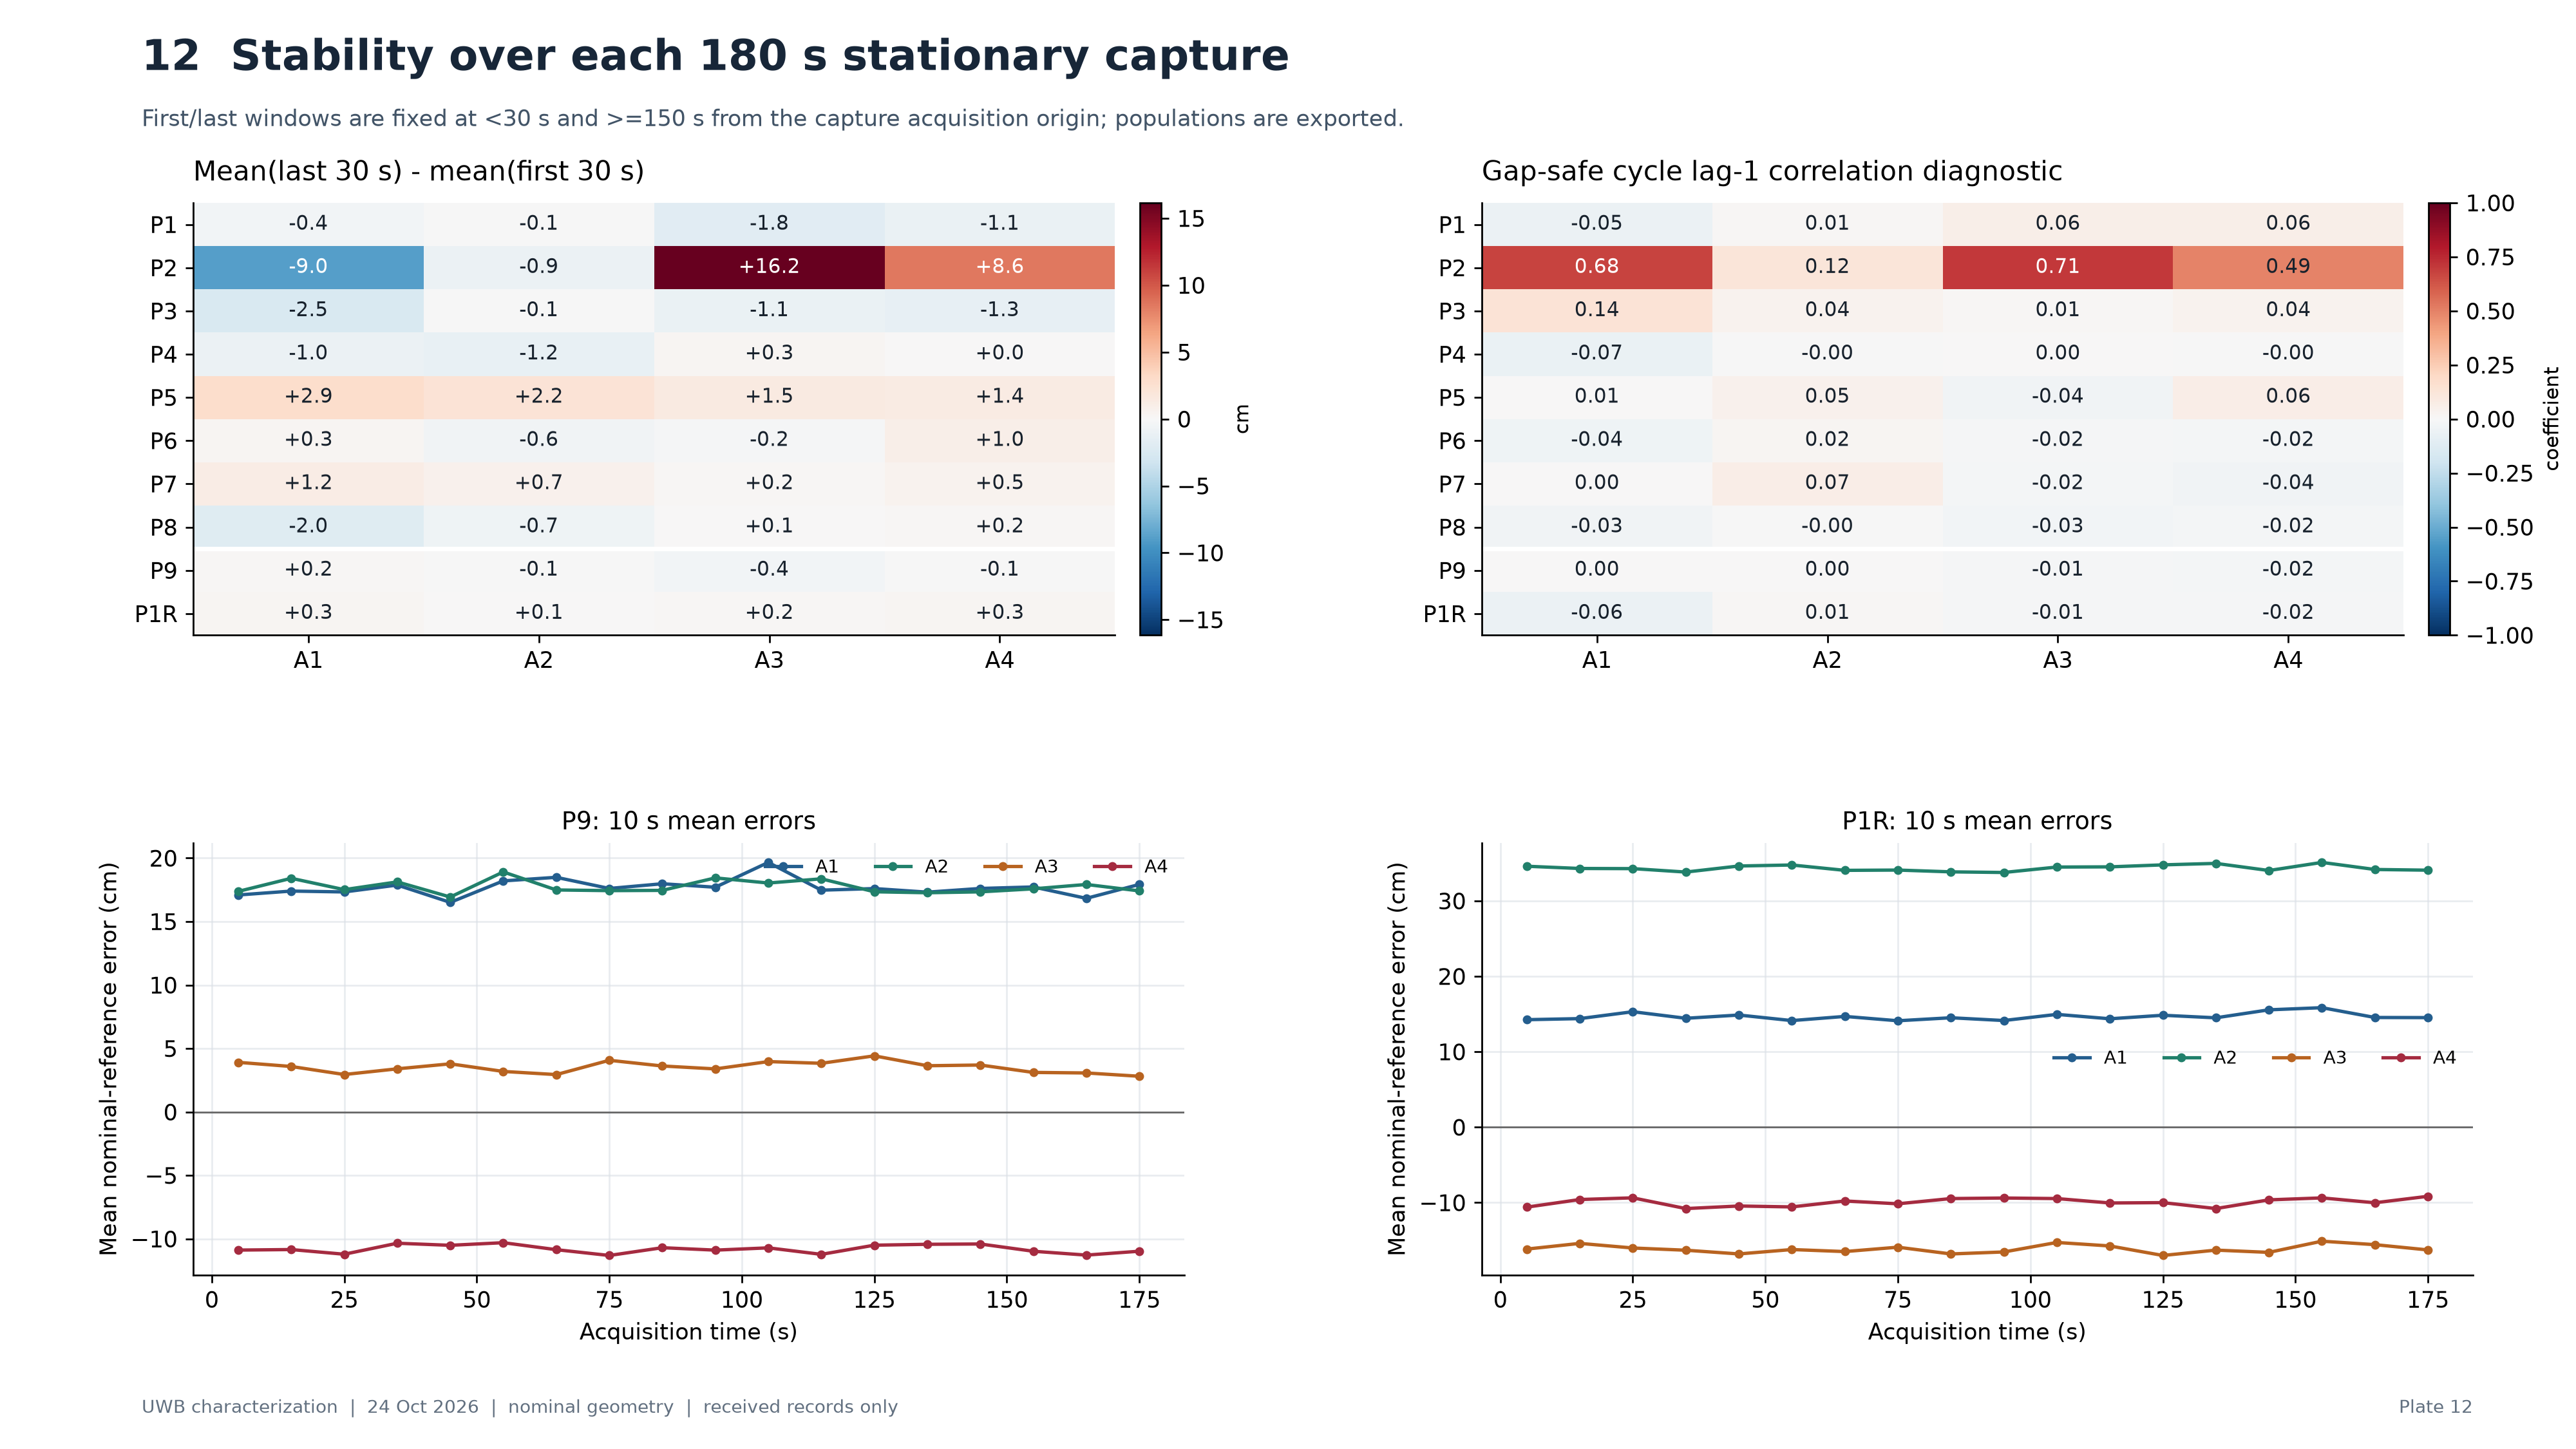
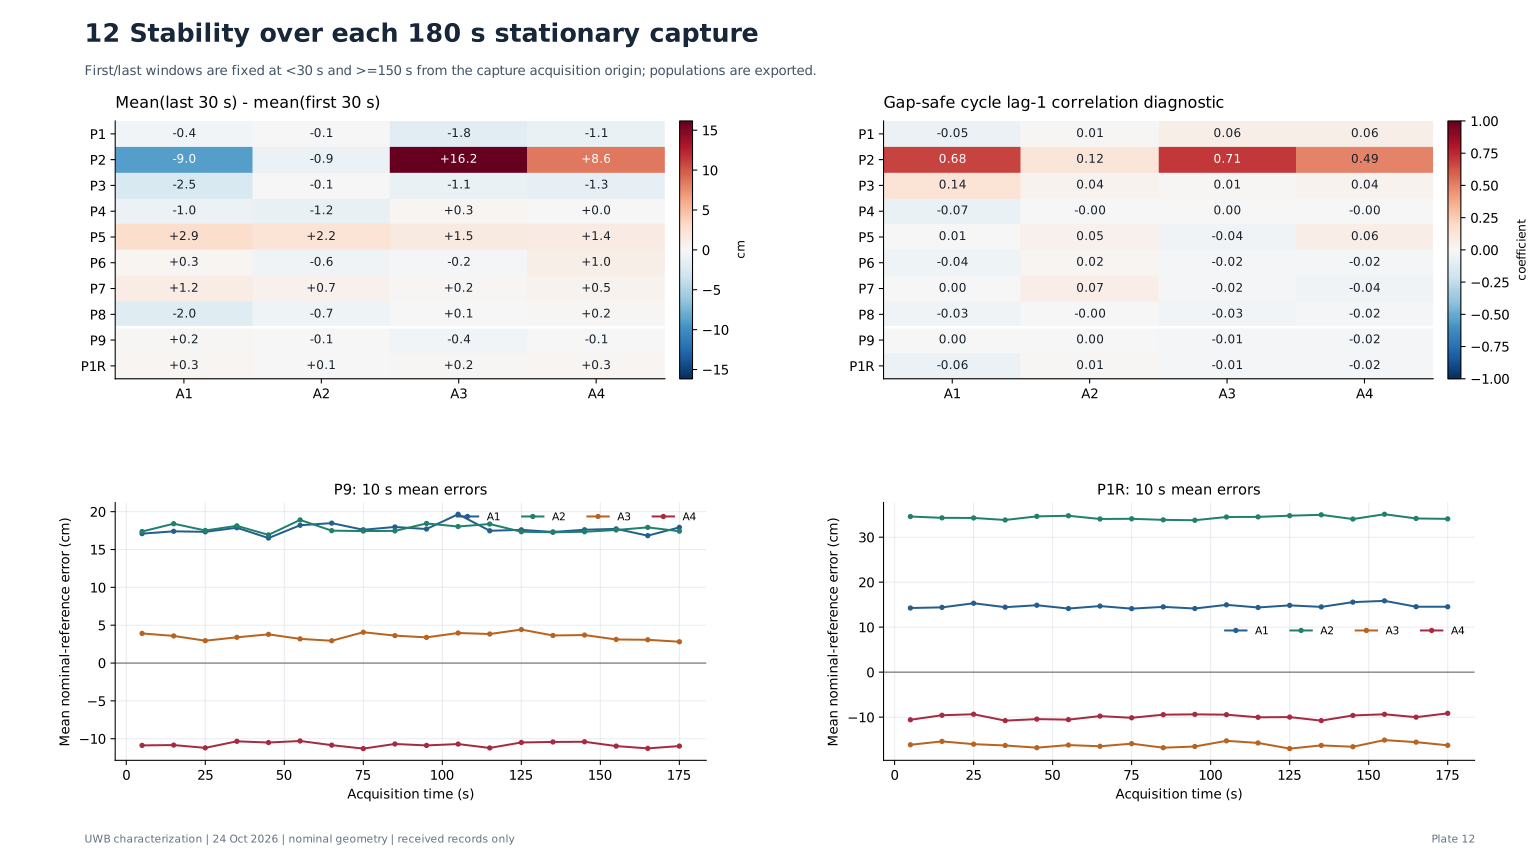
Stability over each 180 s stationary capture
The signed first/last change is descriptive. It does not isolate temperature, drift, multipath or supply effects. Autocorrelation indicates why sample count alone does not establish independent repeats or a standard error.
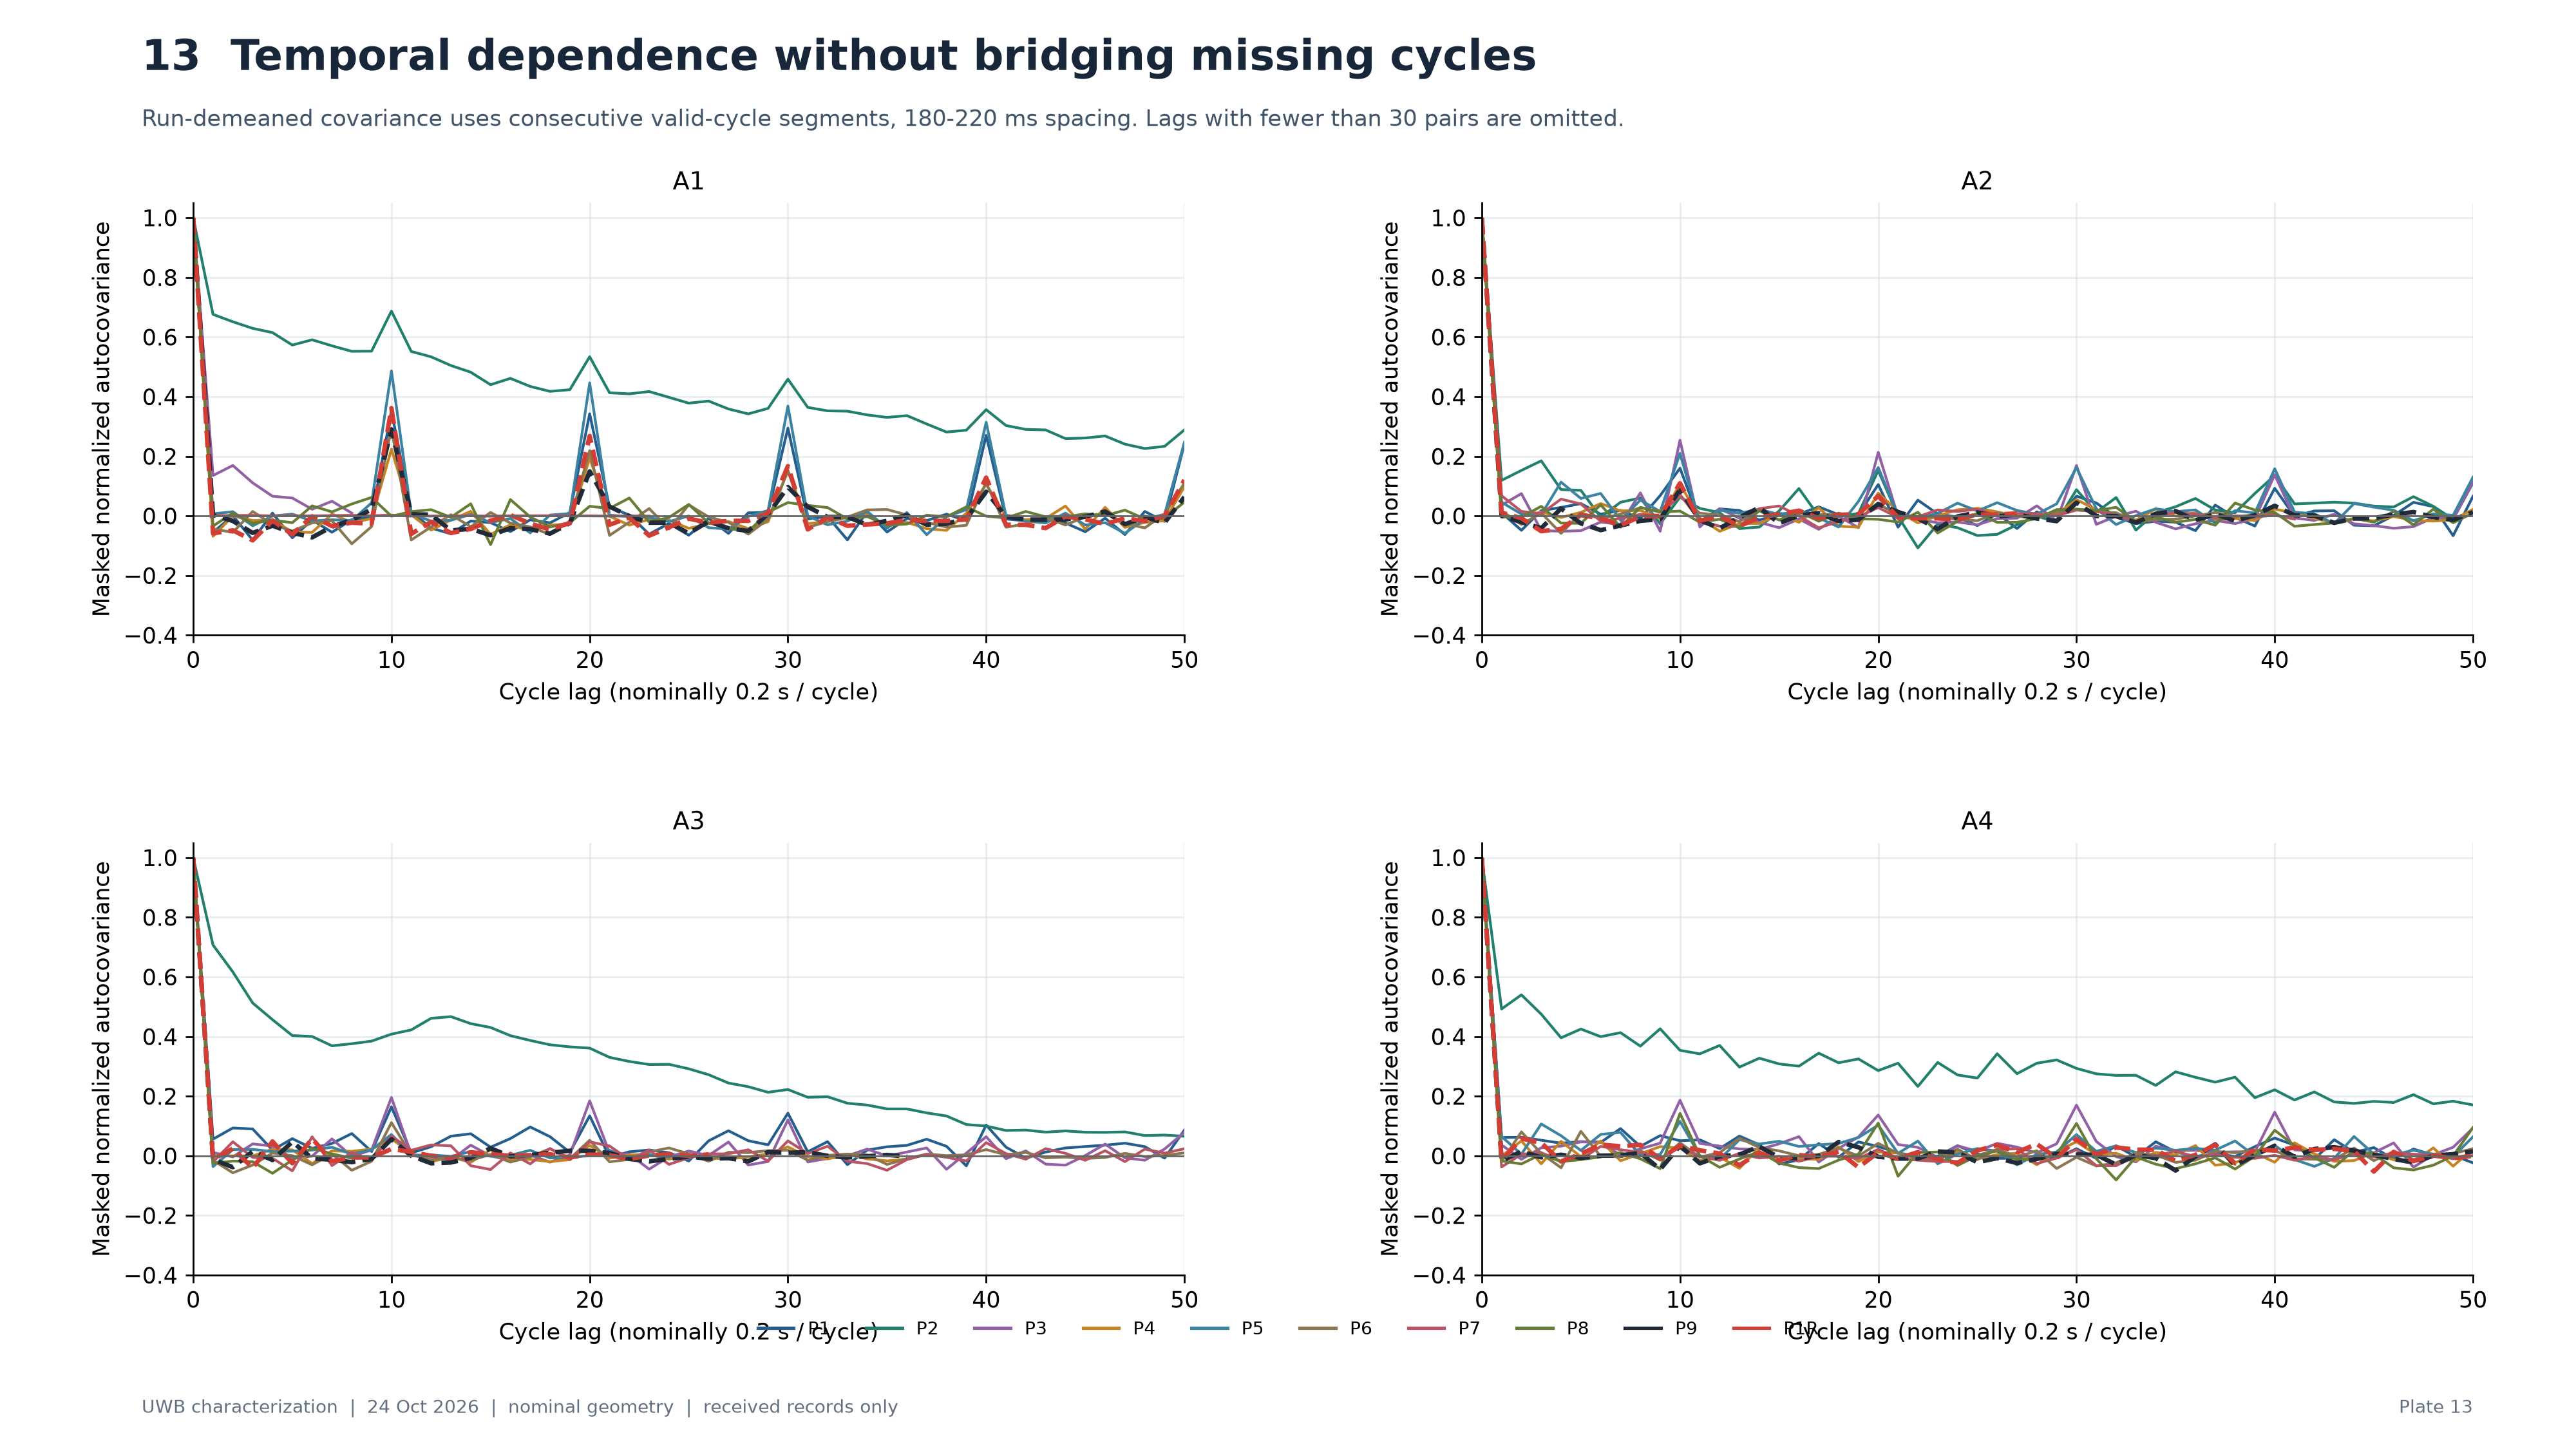
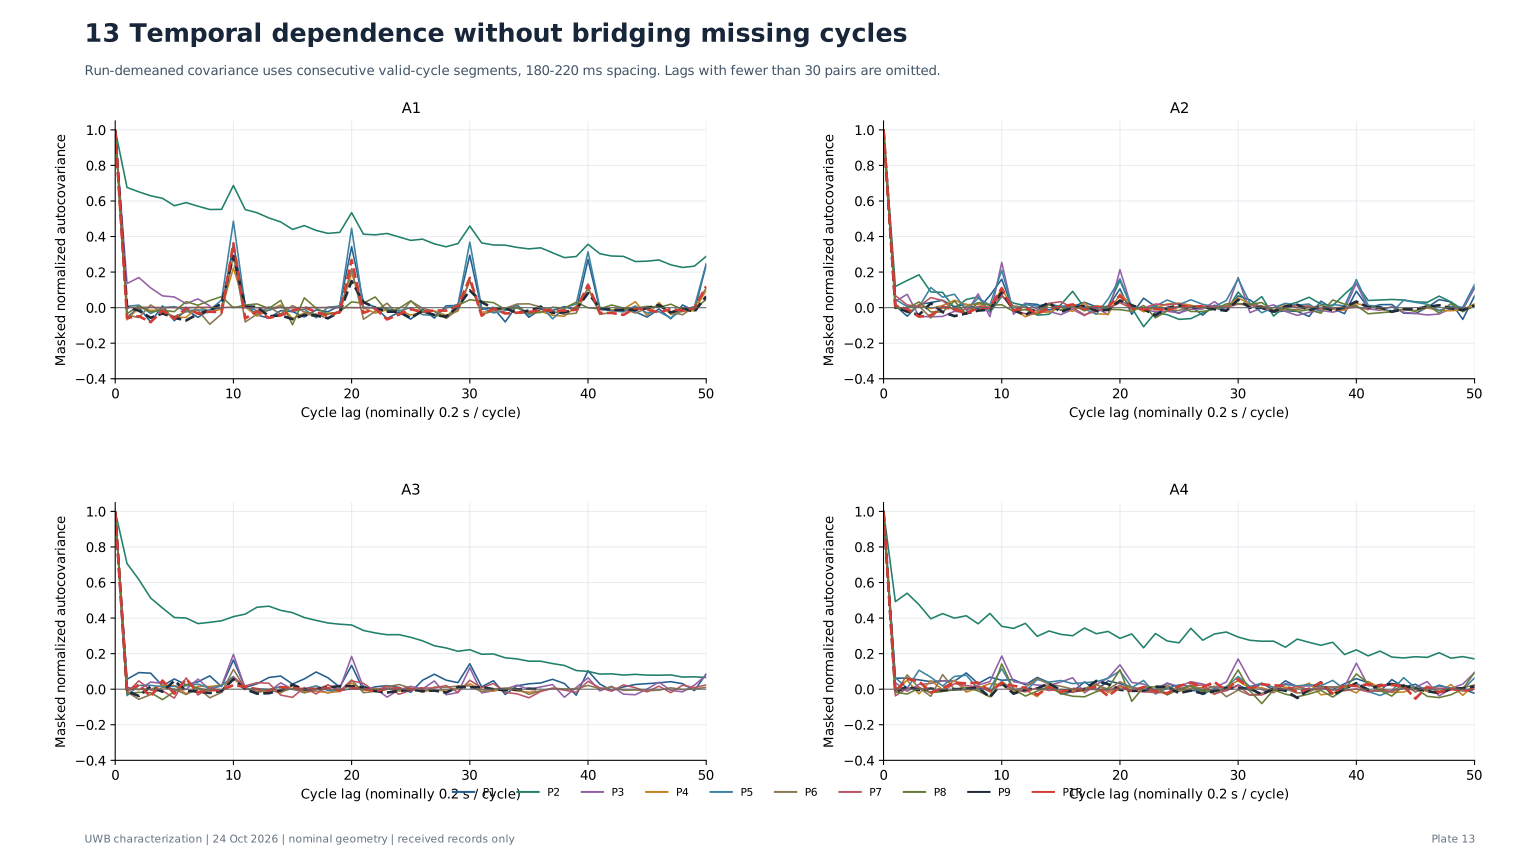
Temporal dependence without bridging missing cycles
Normalization uses total squared deviations of that capture; missing-cycle cross-products are absent. This masked ACF is a descriptive diagnostic. No iid confidence bands, effective sample sizes or sqrt(n) uncertainty claims are made.
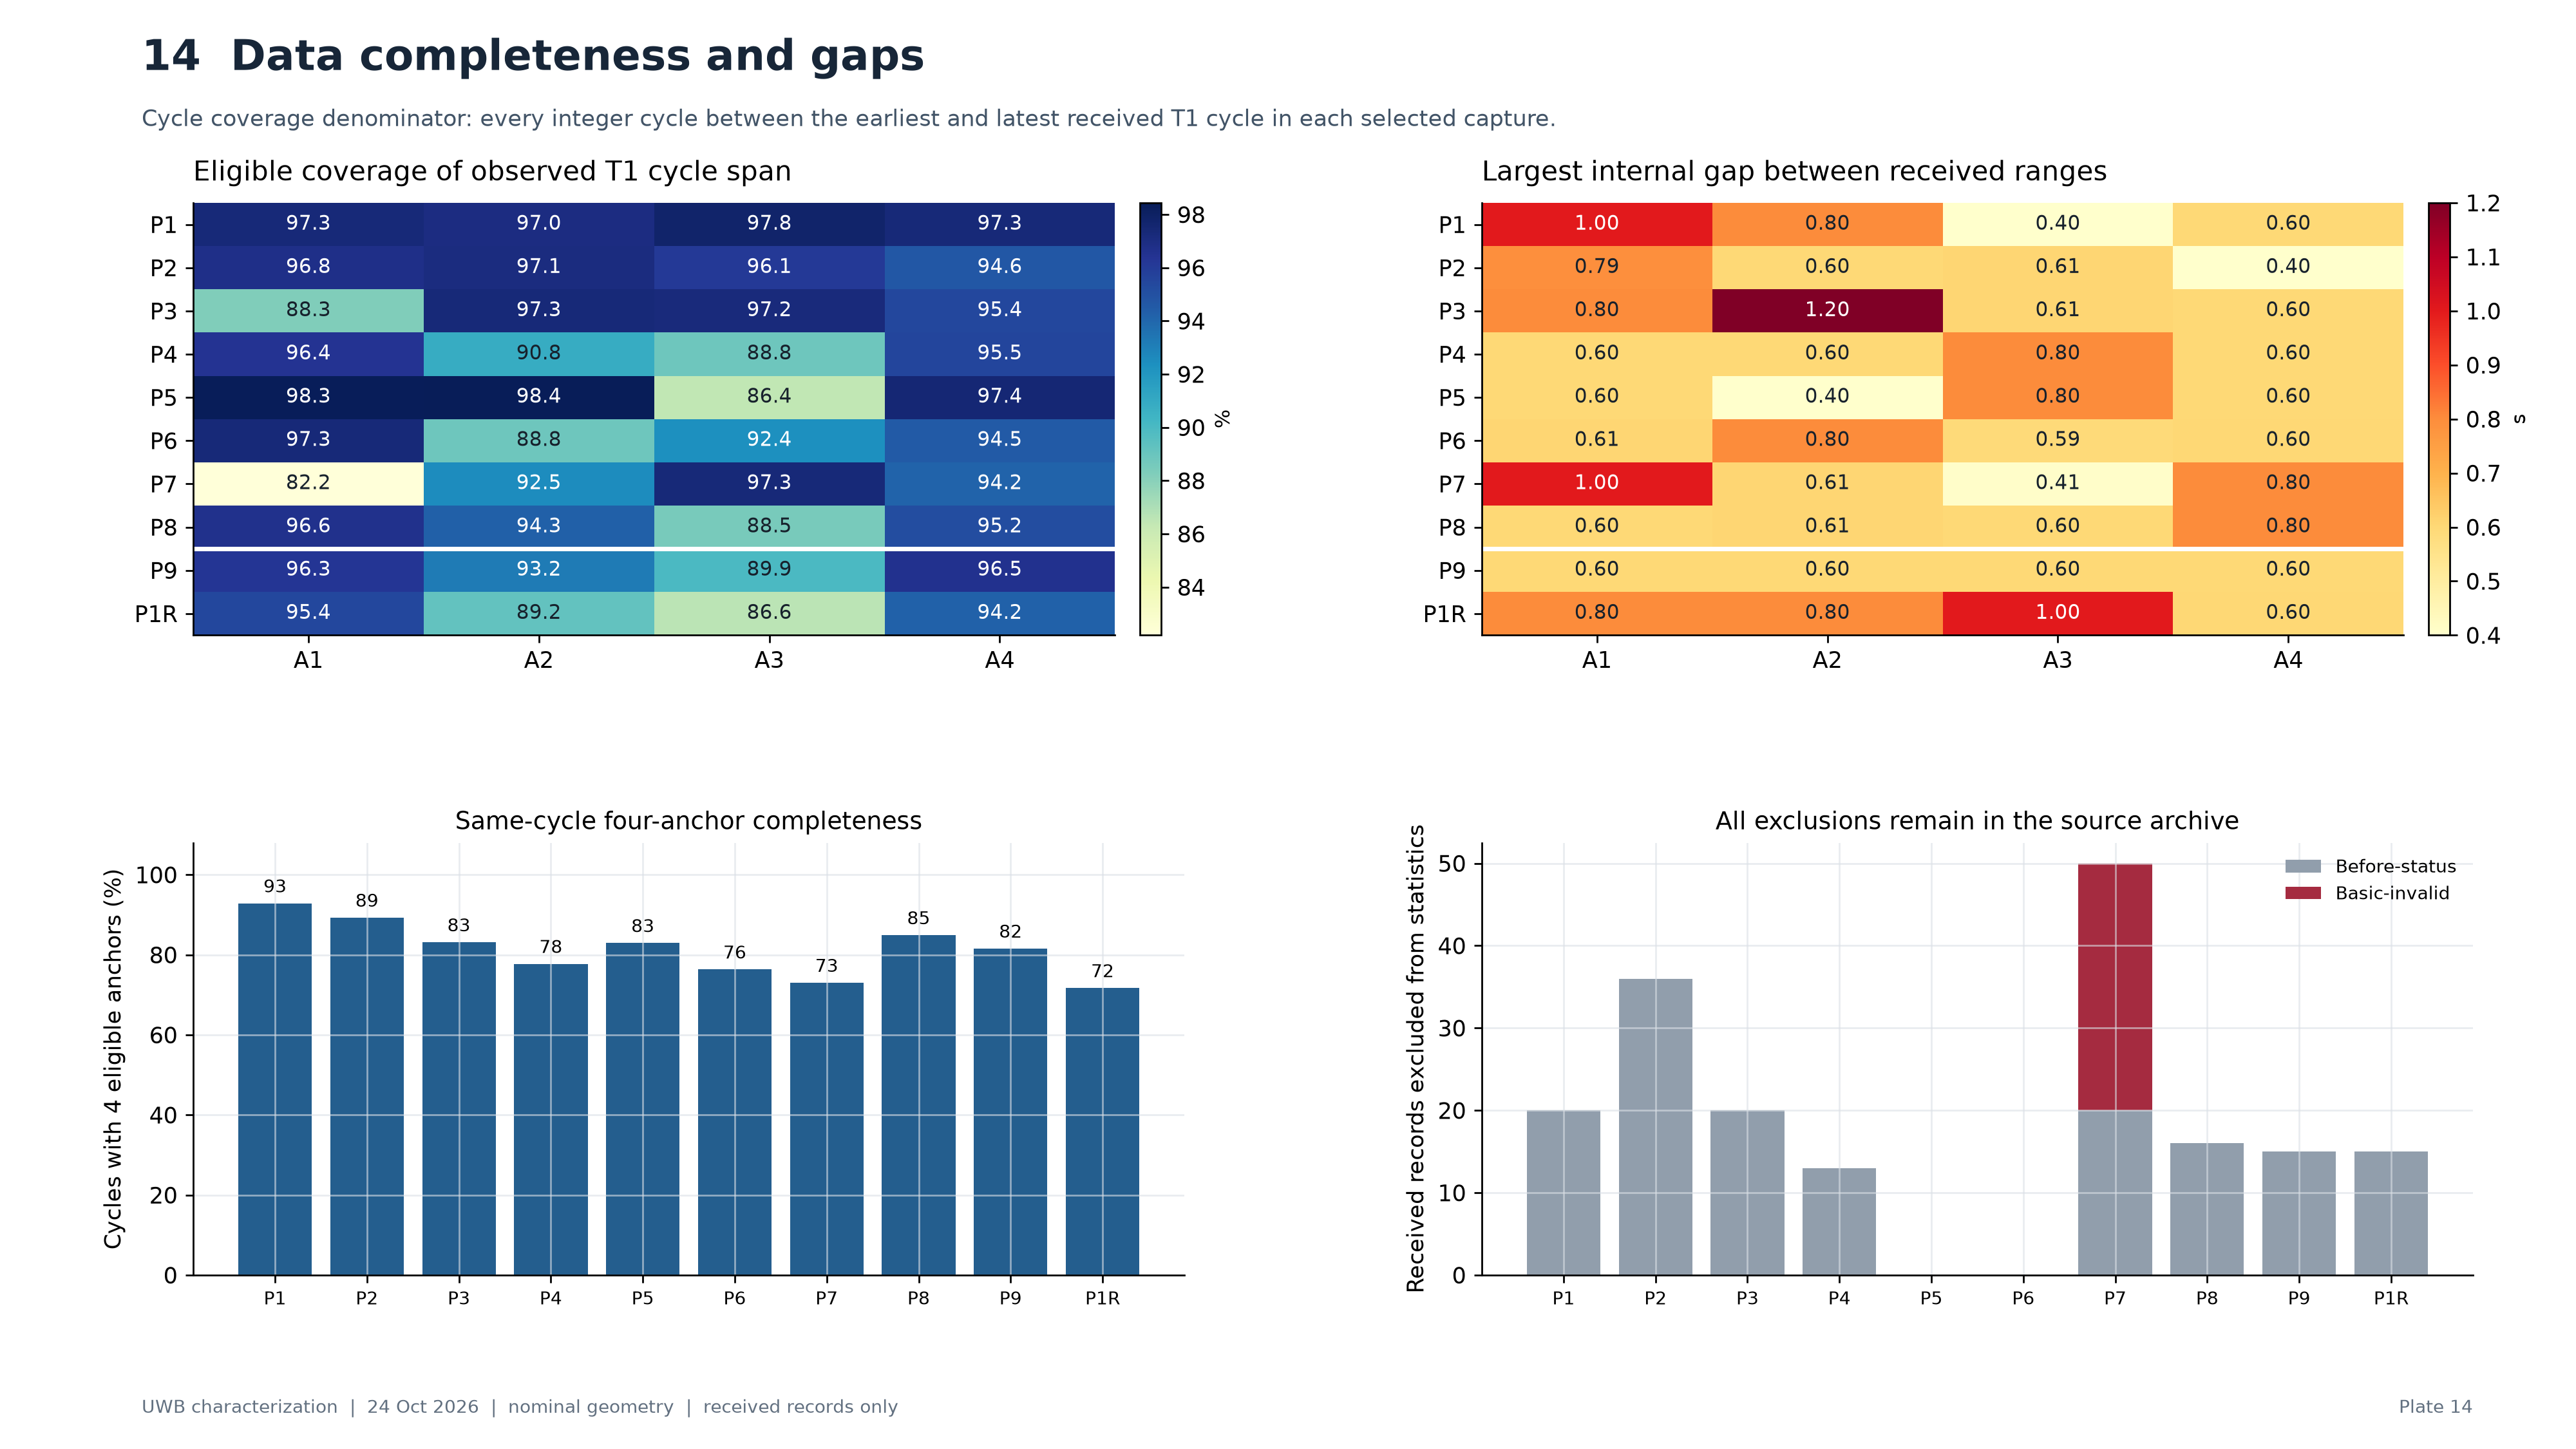
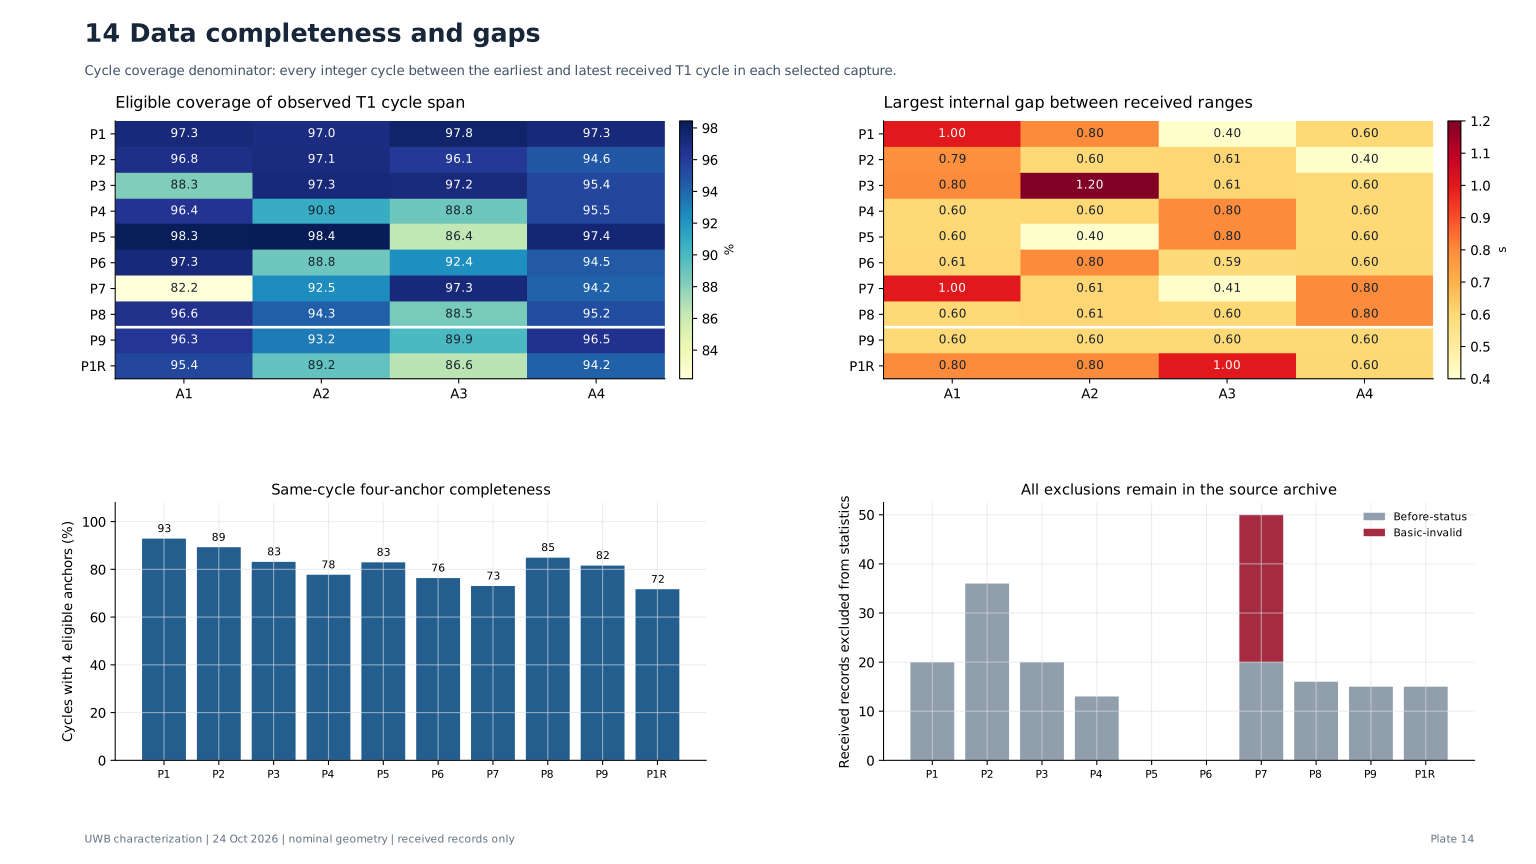
Data completeness and gaps
Coverage is not radio packet-delivery ratio: a missing report may arise anywhere in ranging, forwarding, serial or status acceptance. Maximum gap excludes leading/trailing capture silence. Four-anchor completeness is not XY accuracy.
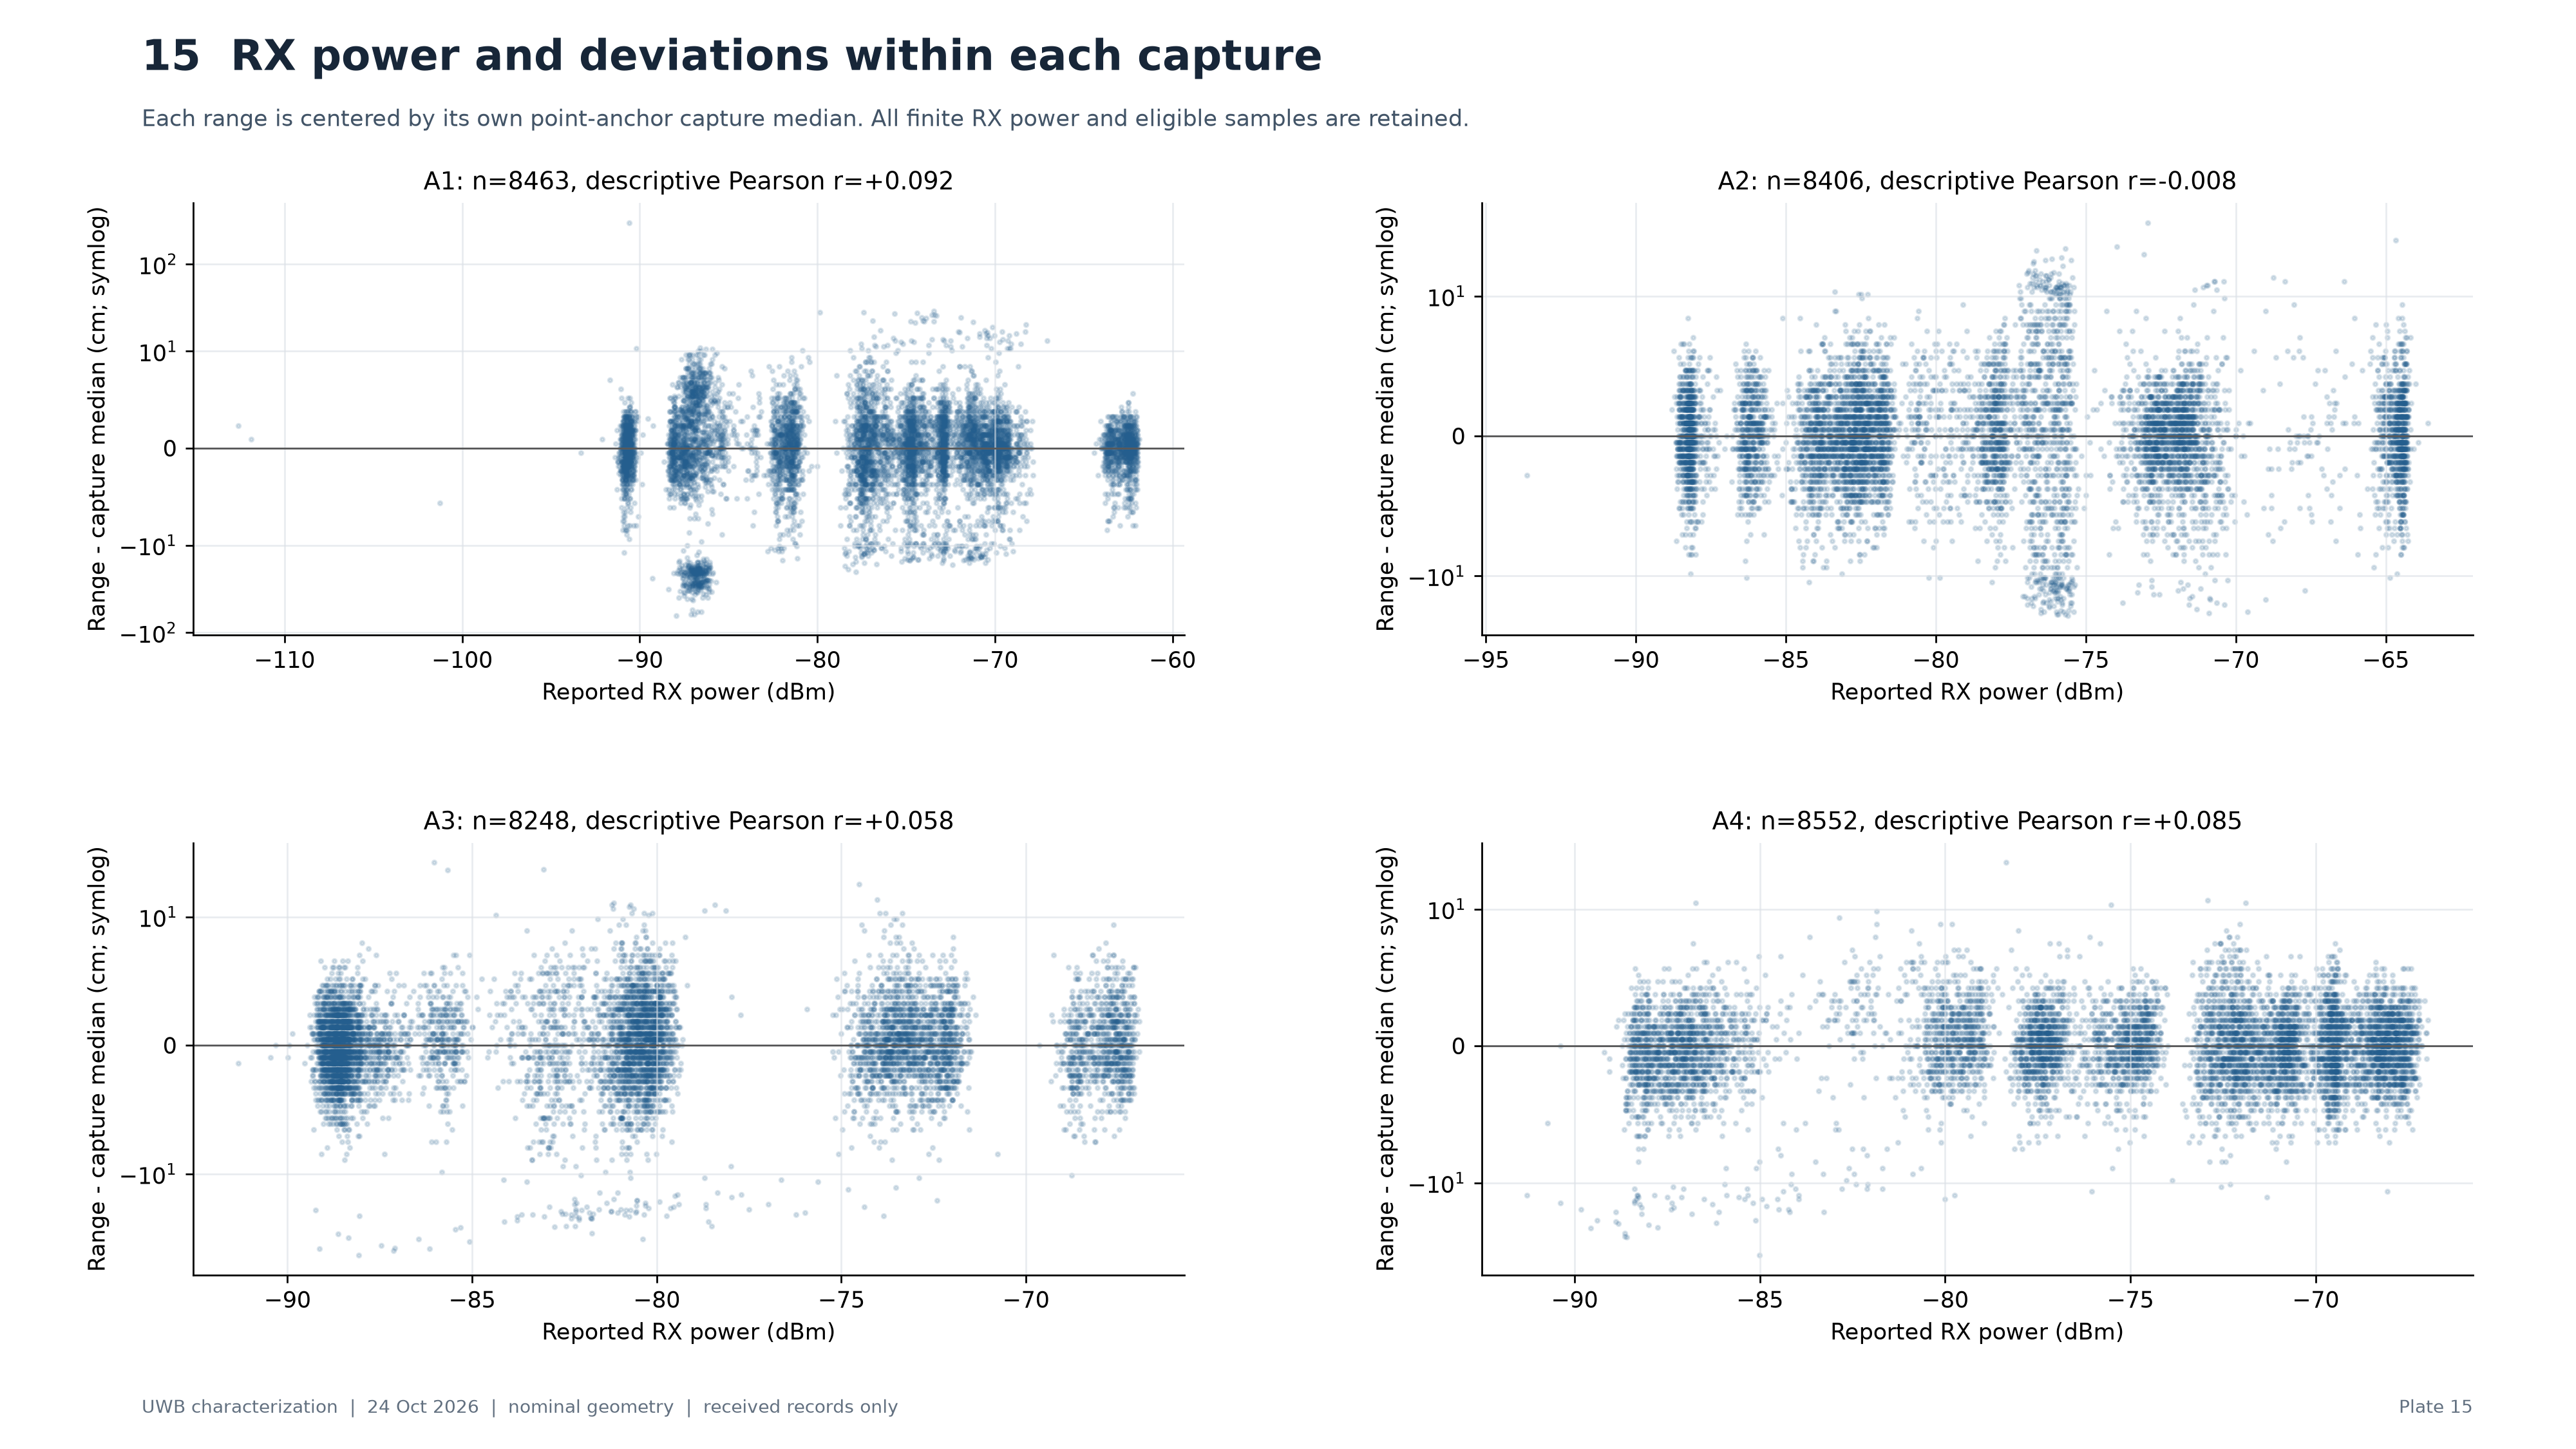
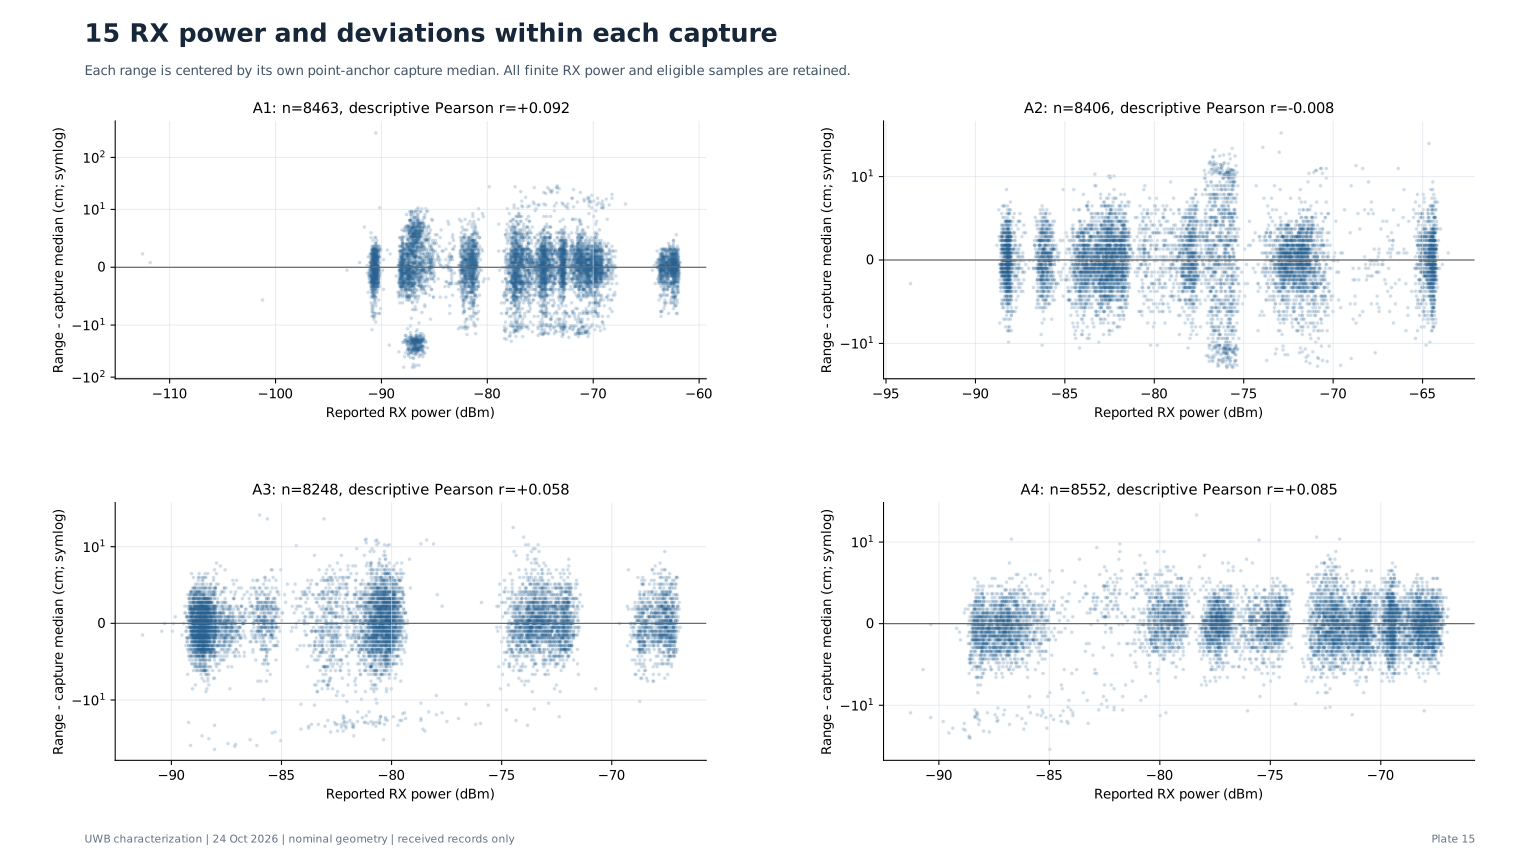
RX power and deviations within each capture
Reported RX power is a diagnostic covariate, not an independent distance truth or an NLOS classifier. Centering removes capture offsets but does not control all confounding. Correlations do not establish a cause.
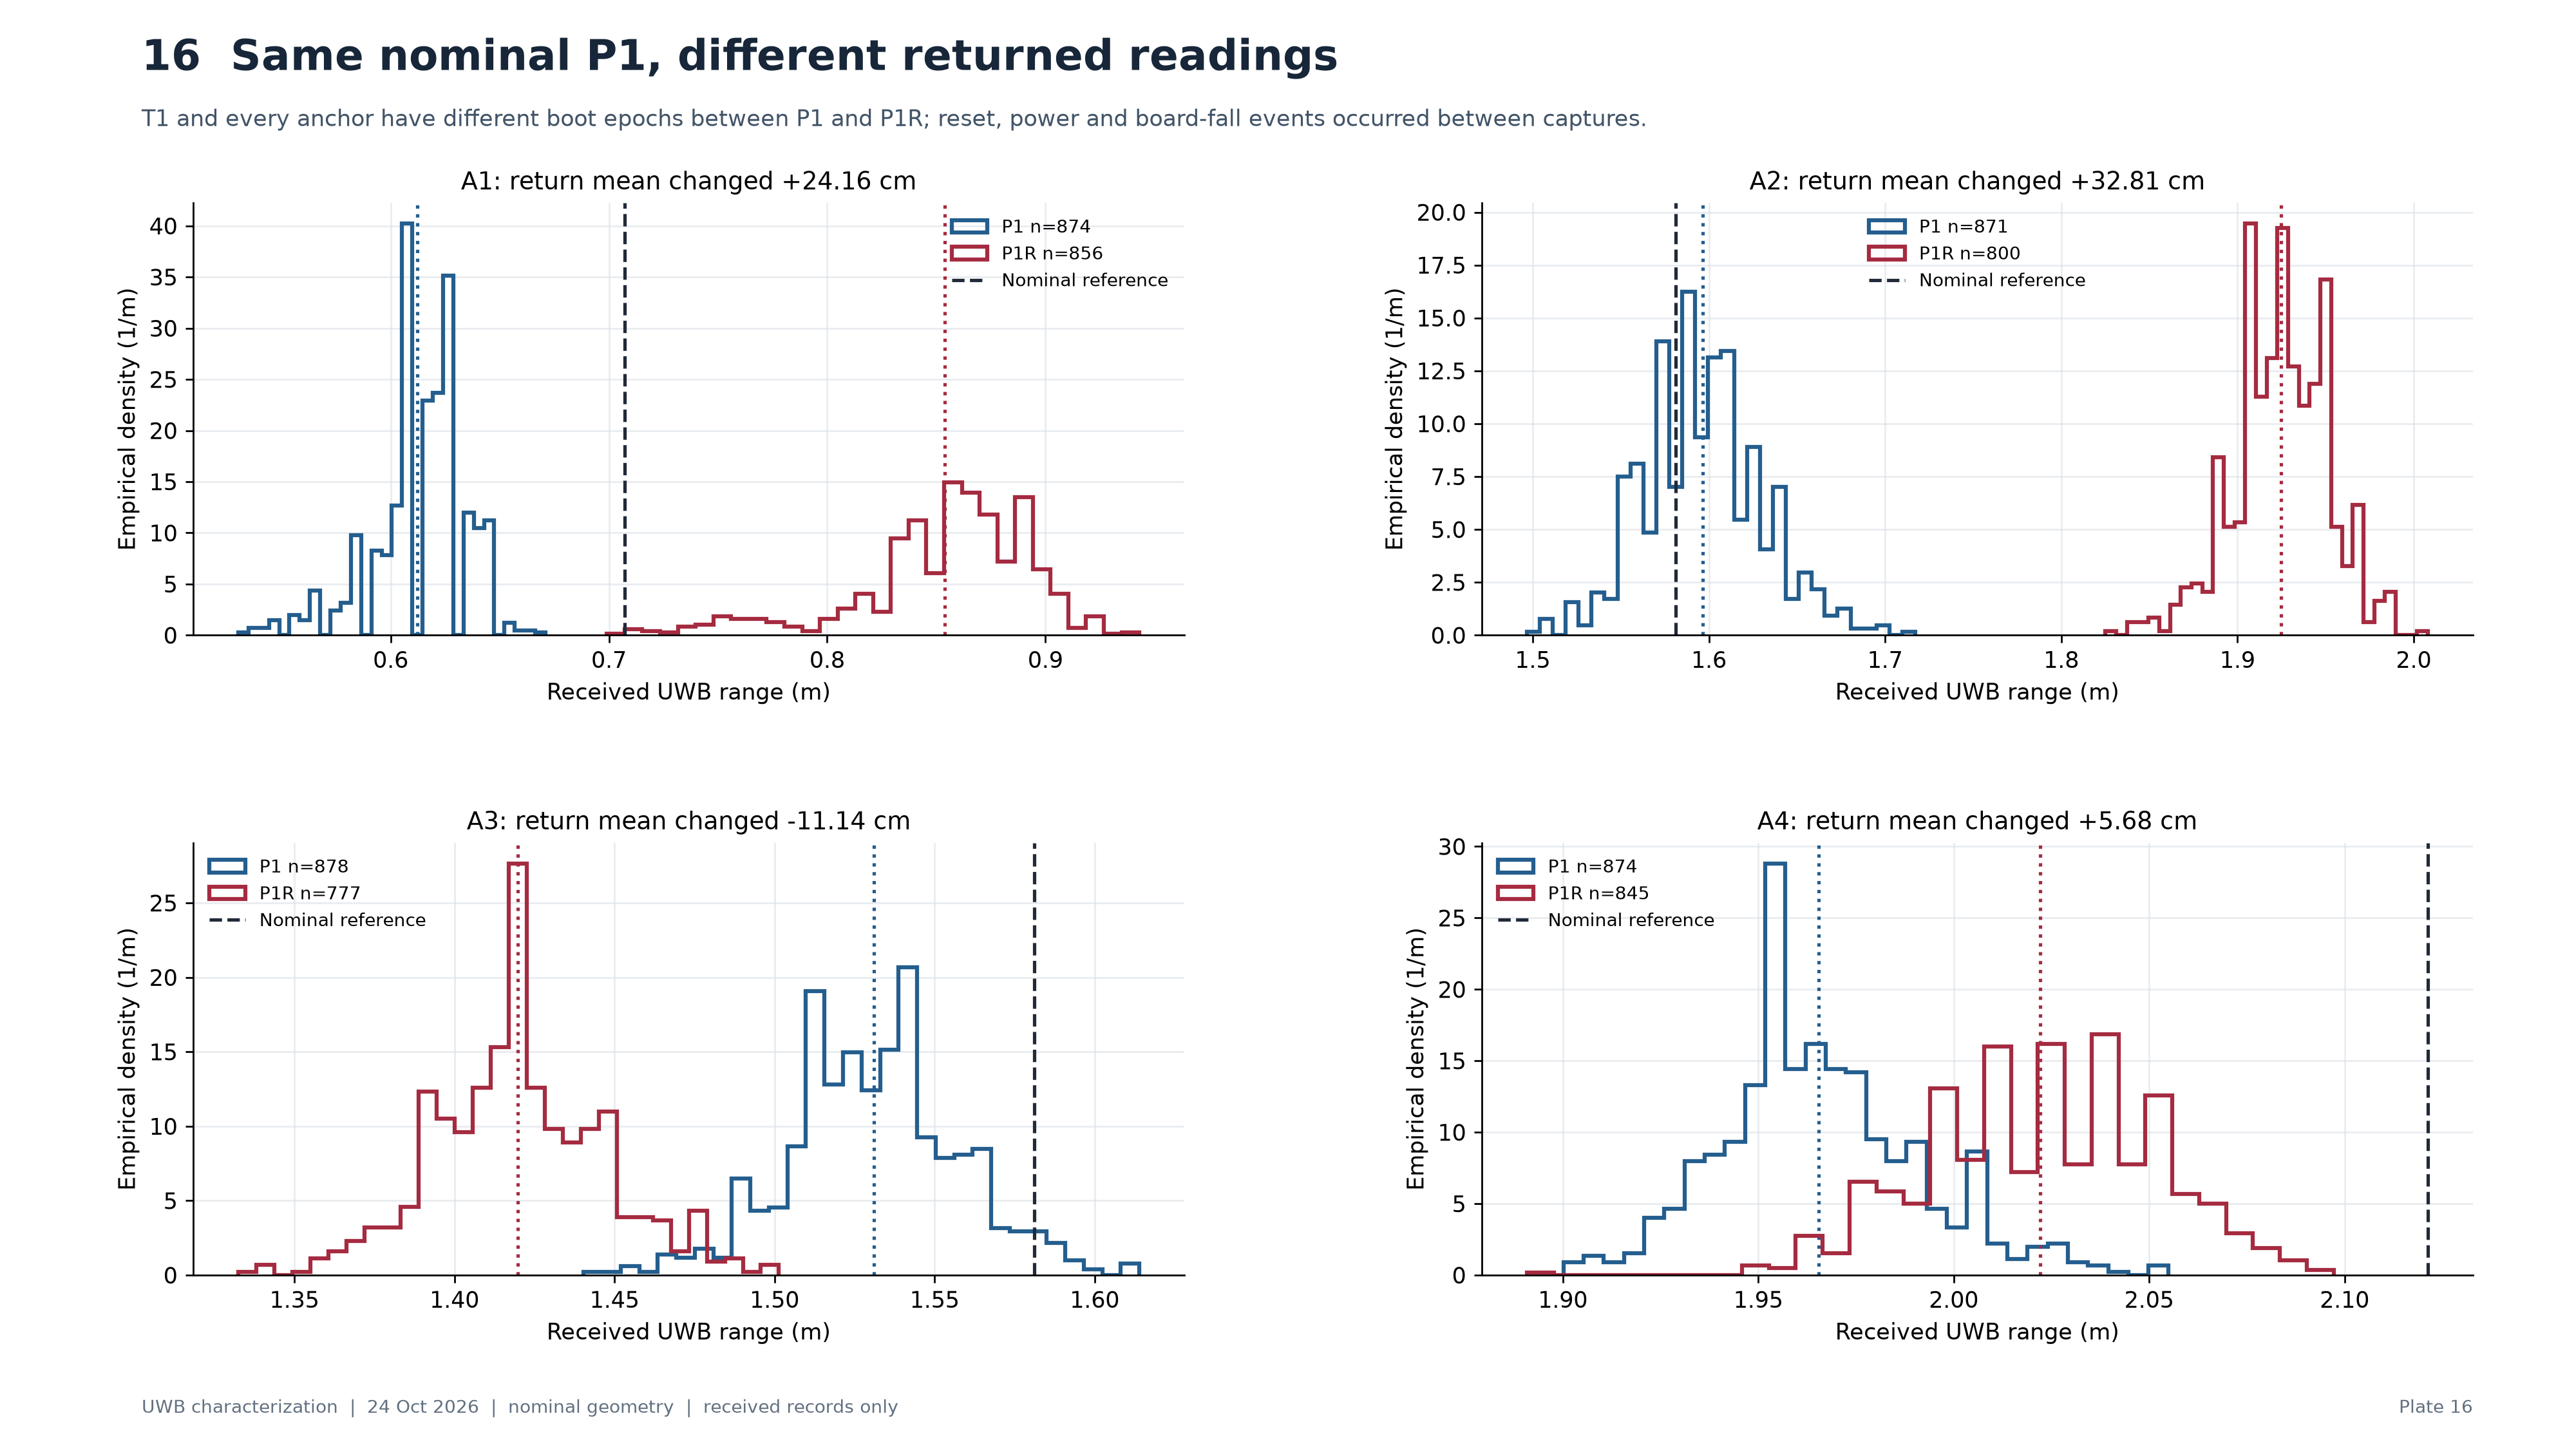
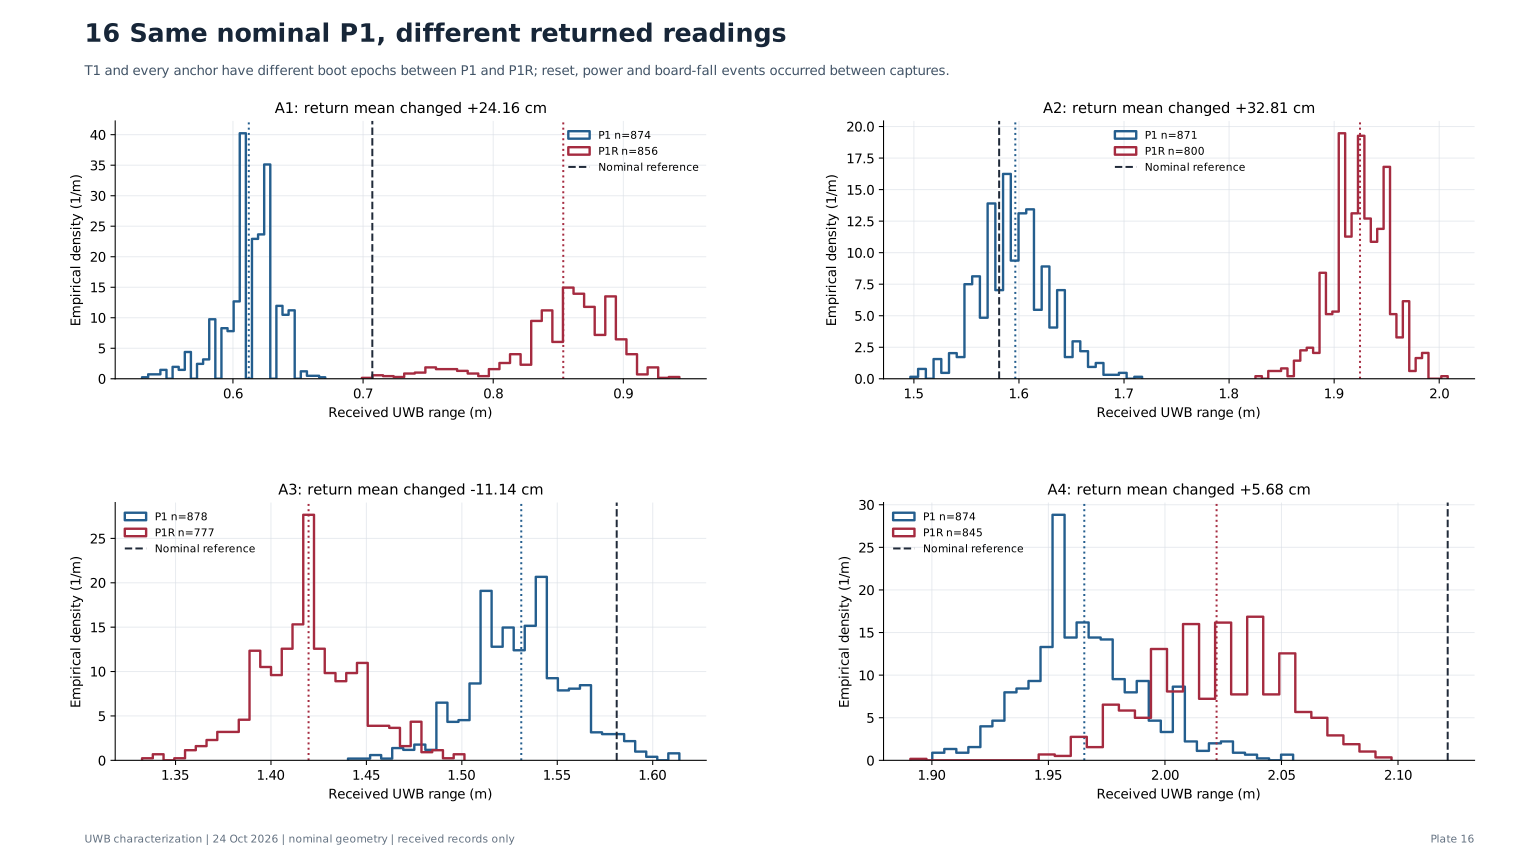
Same nominal P1, different returned readings
The comparison demonstrates a difference under changed conditions. It cannot isolate time drift, reset sensitivity, handling, antenna orientation or geometry as the cause. There is one return comparison, not a reproducibility study.
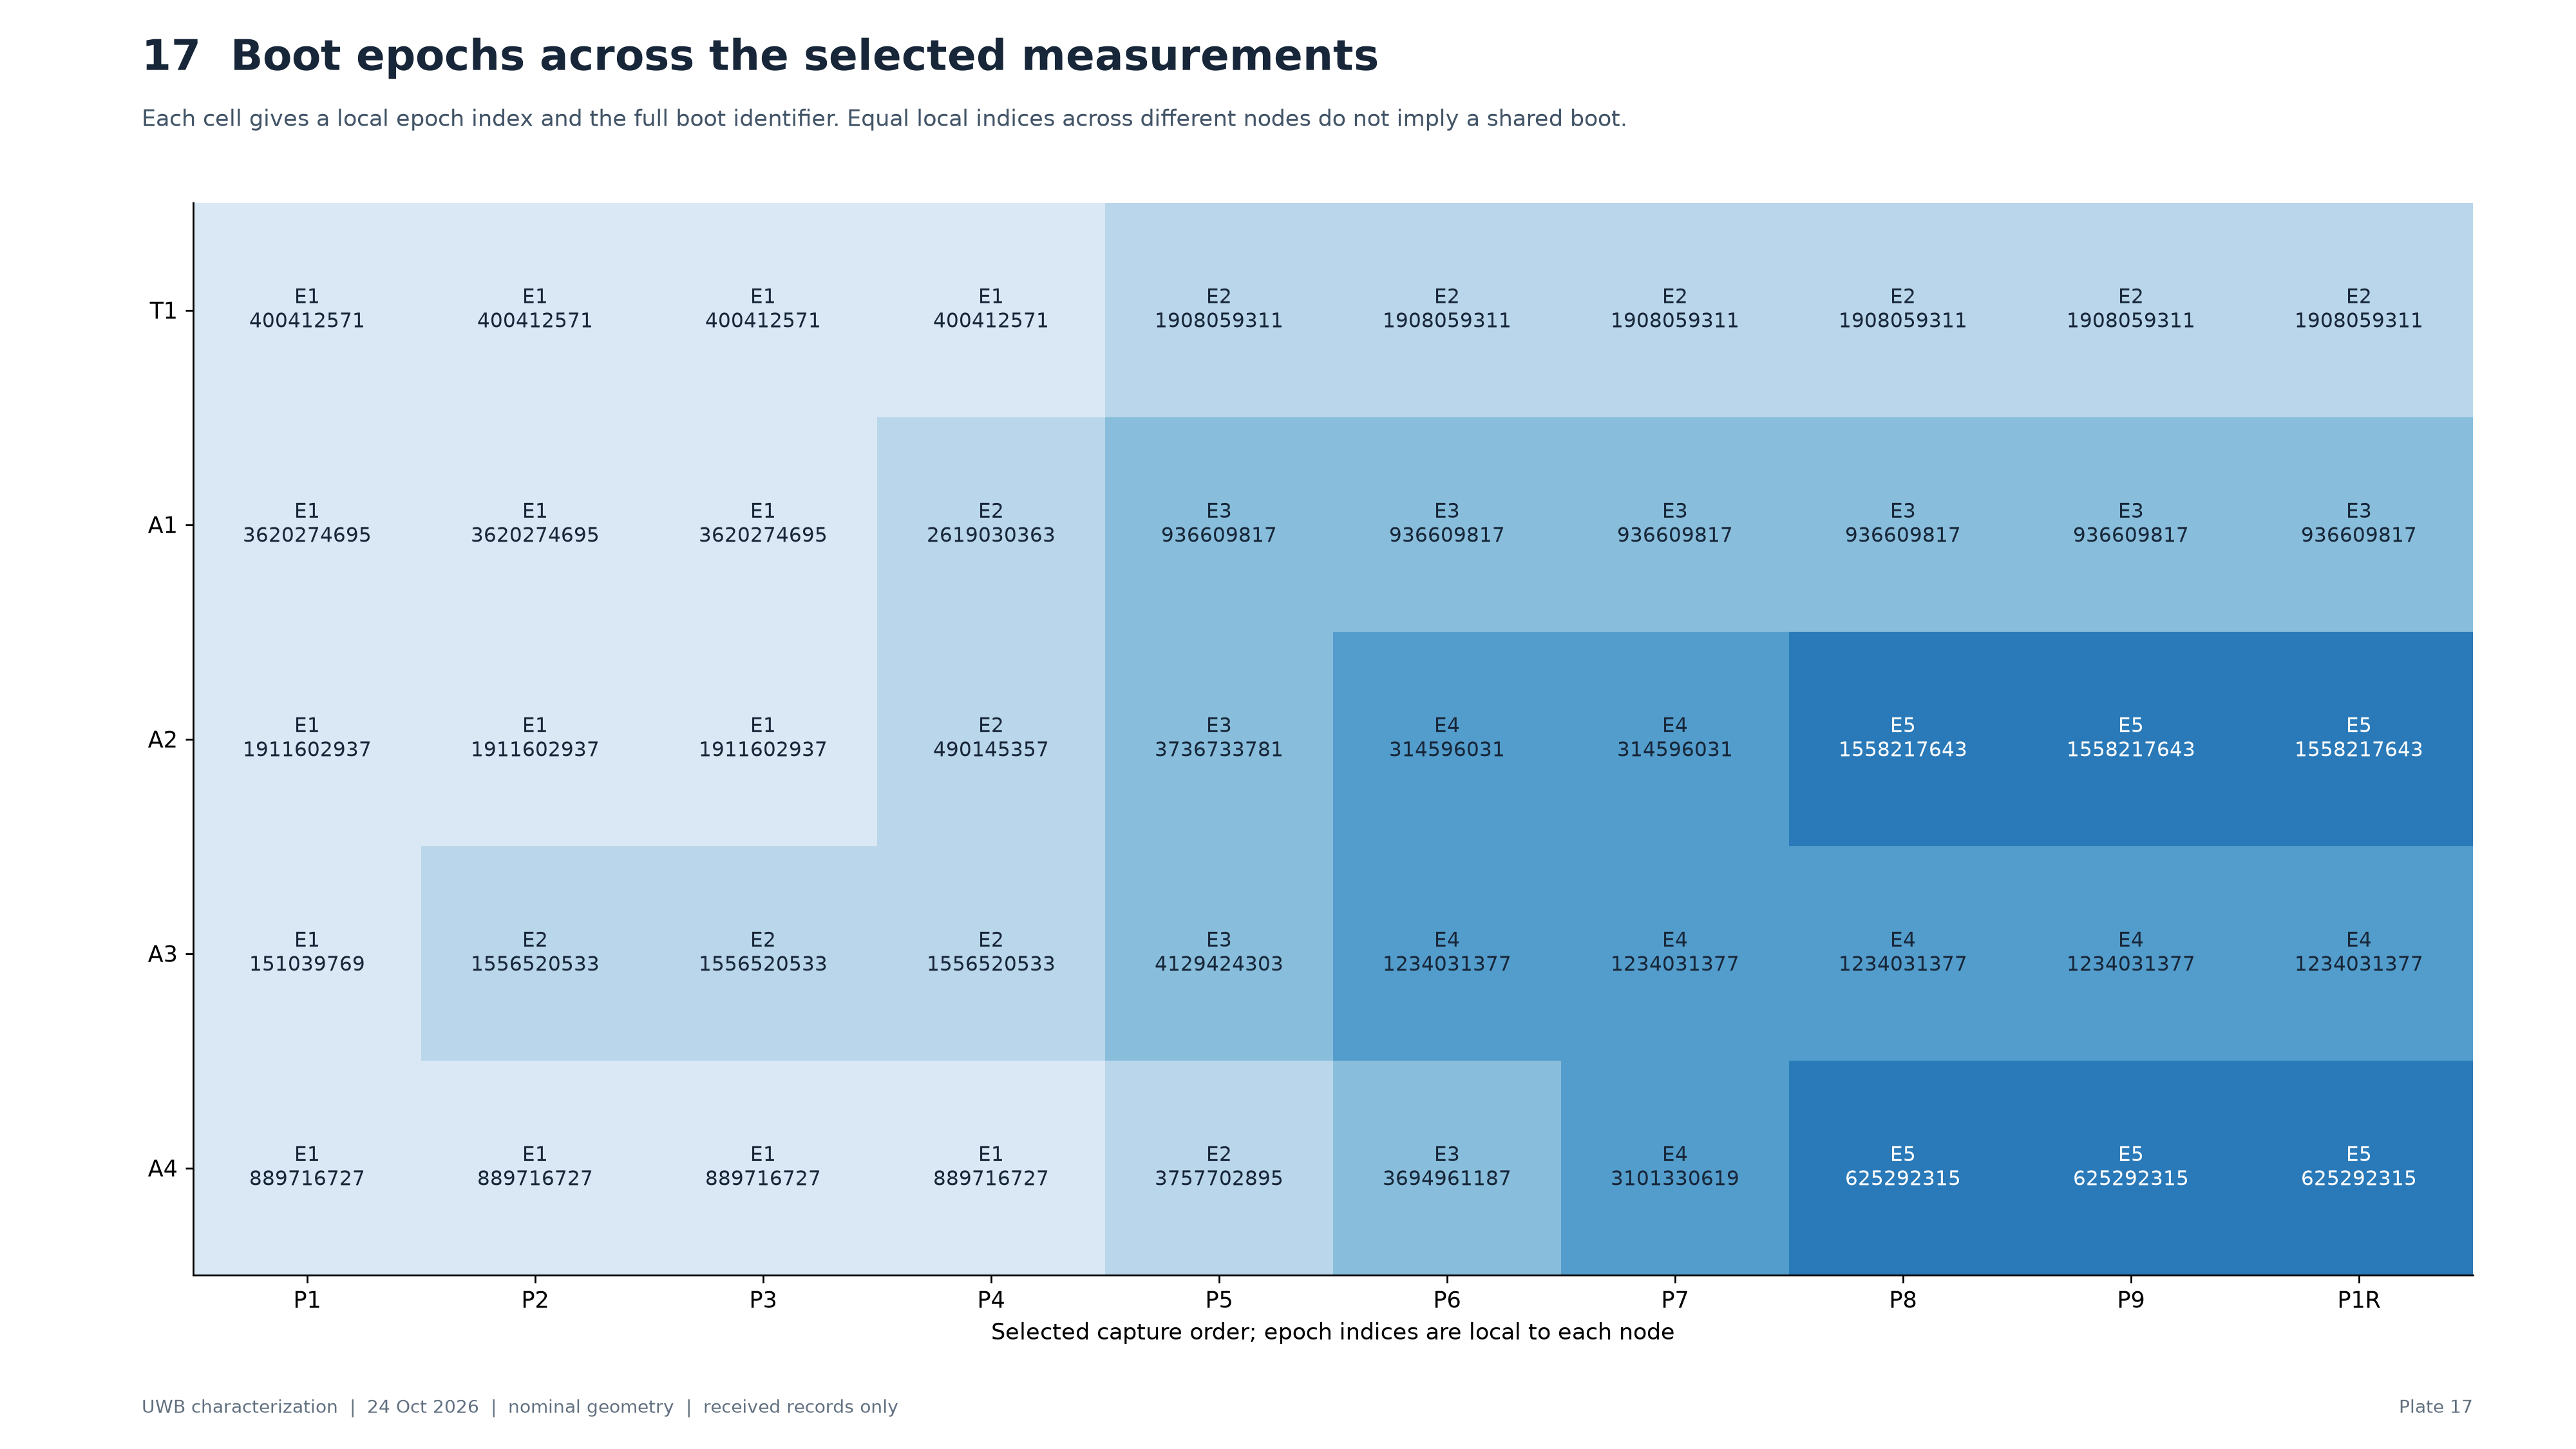
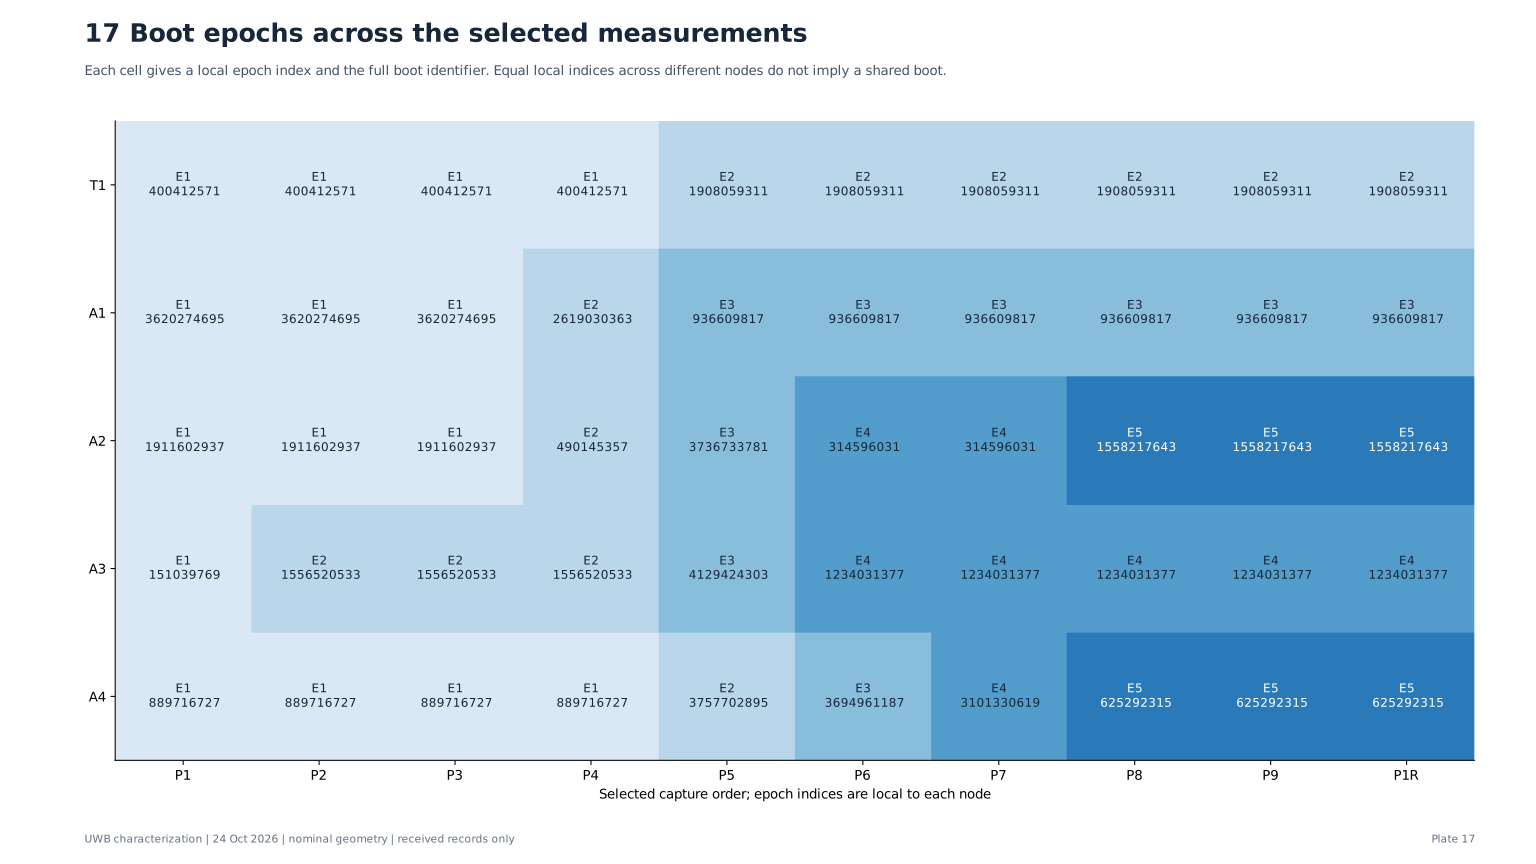
Boot epochs across the selected measurements
No selected capture combines multiple boot pairs for an anchor. Boot changes between captures are preserved. An observed boot change without an operator event does not establish why a node restarted.
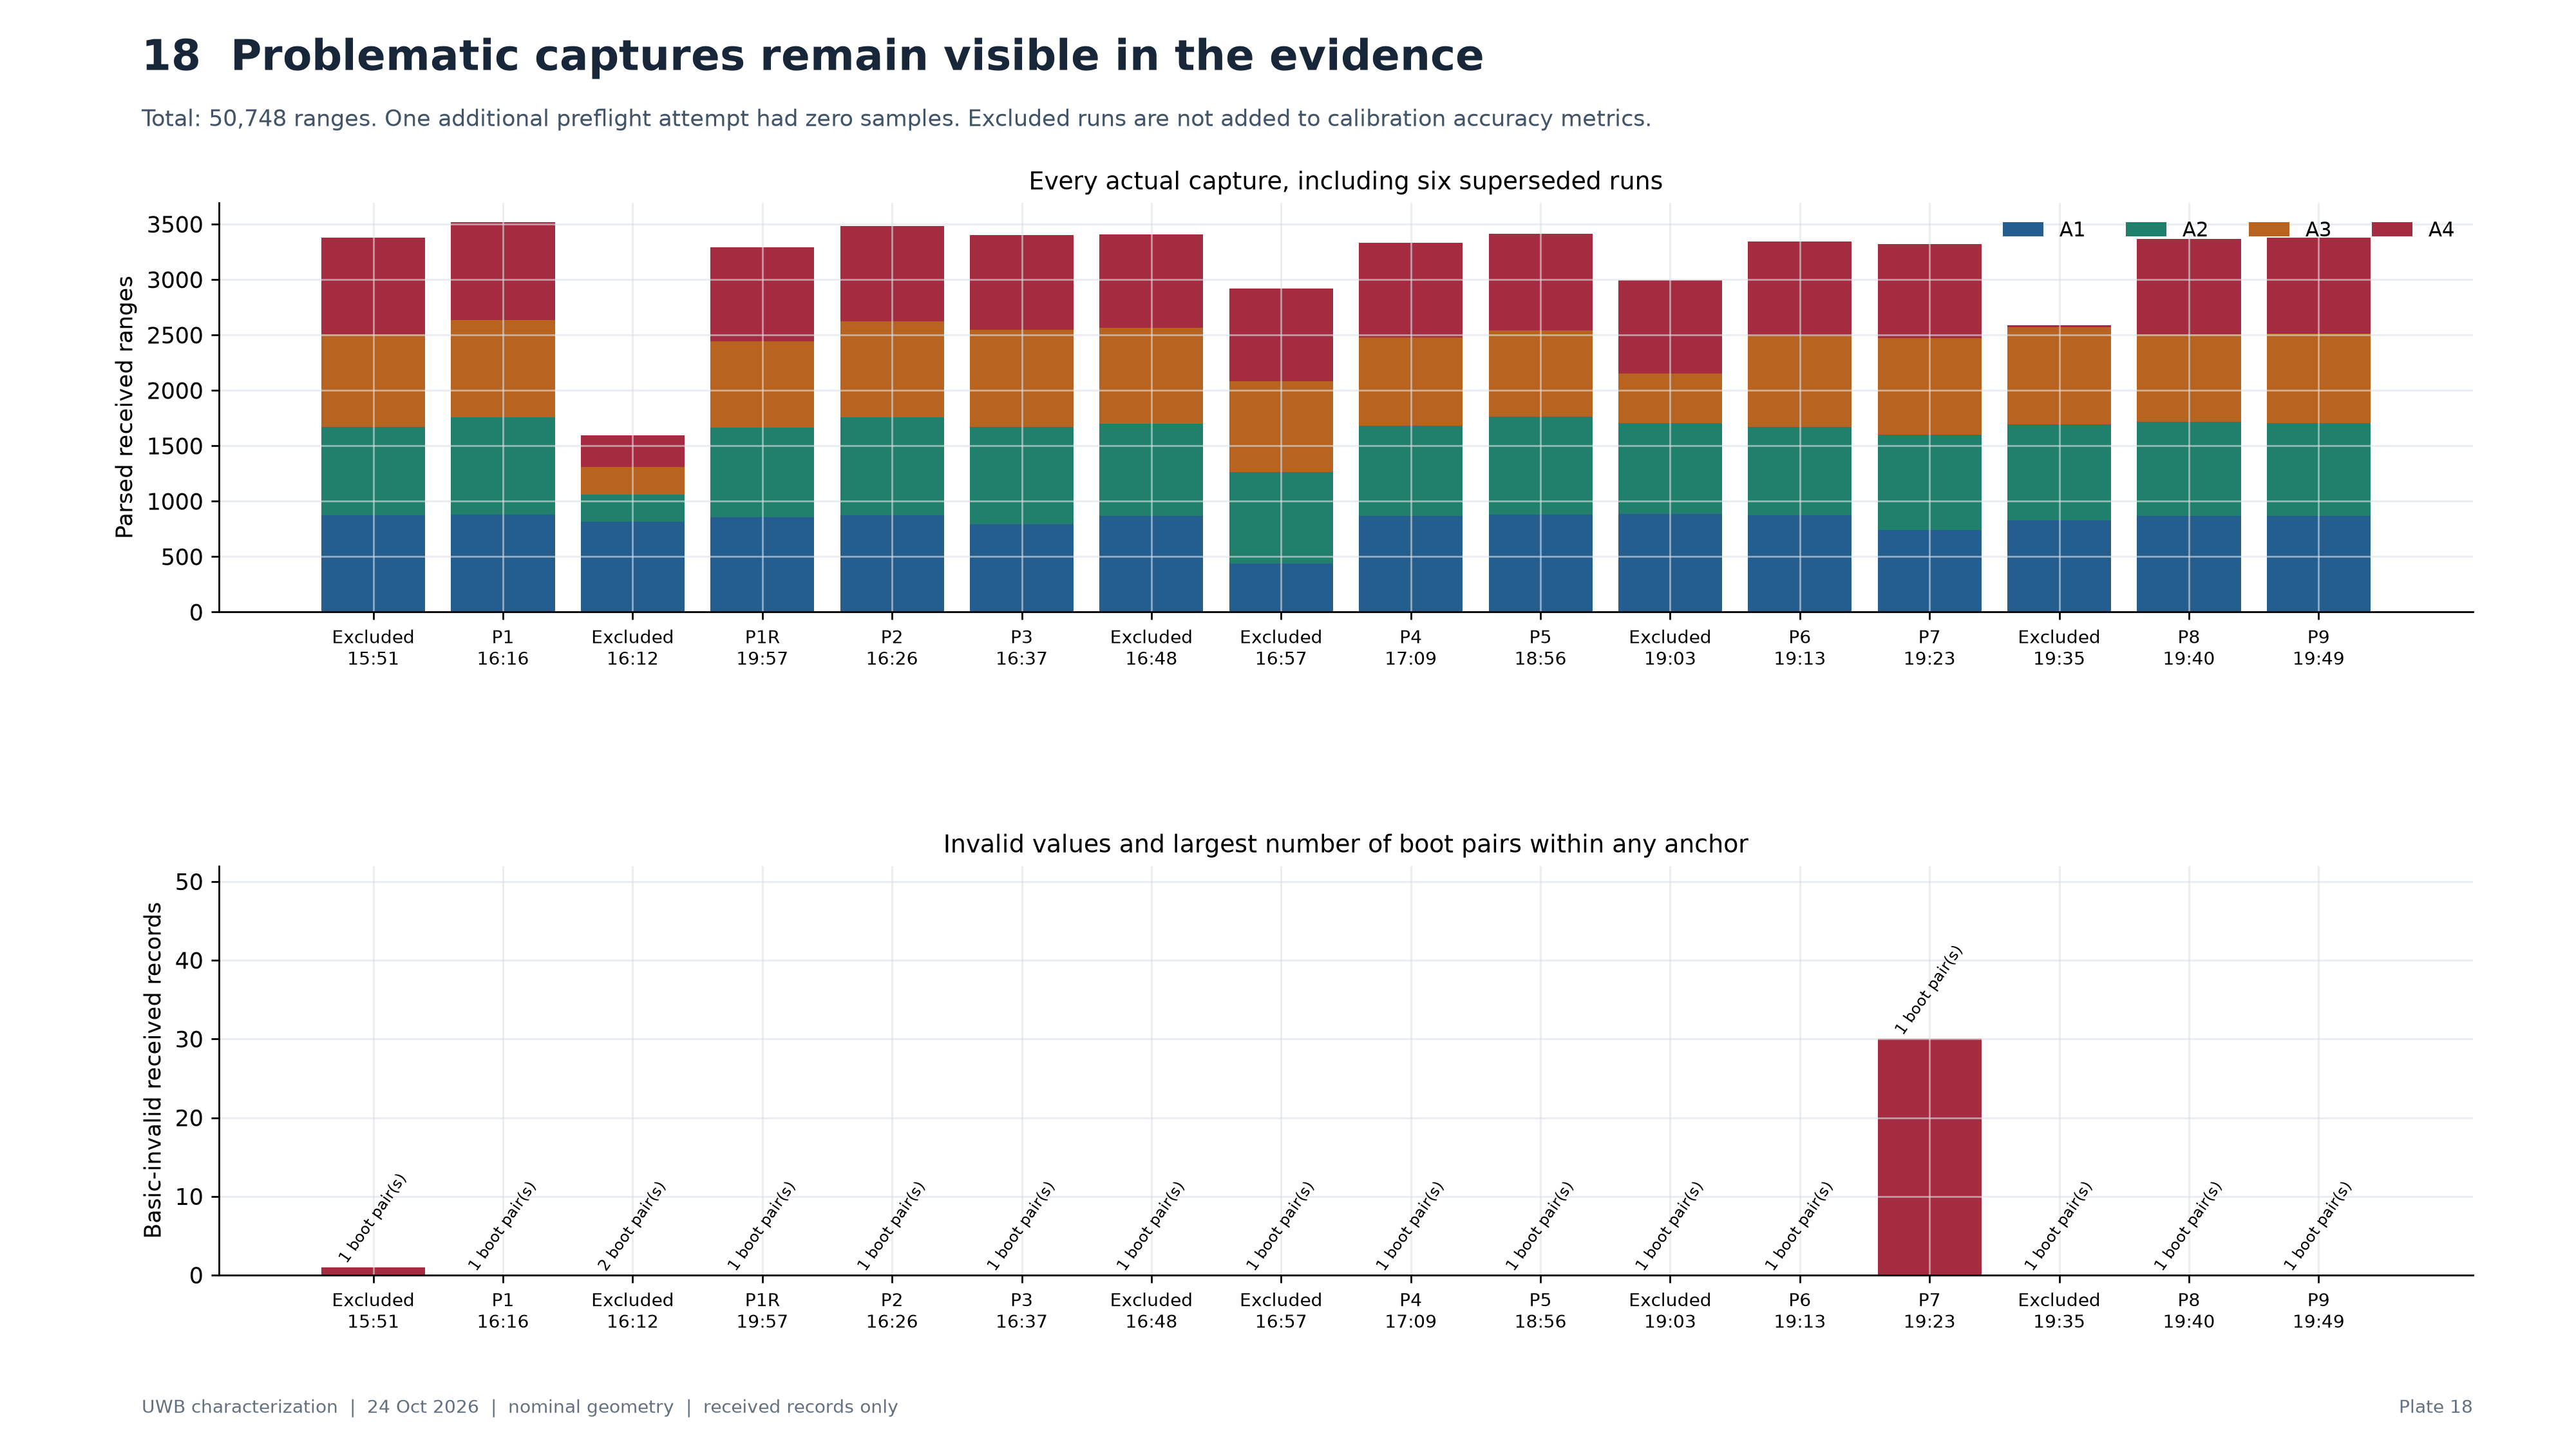
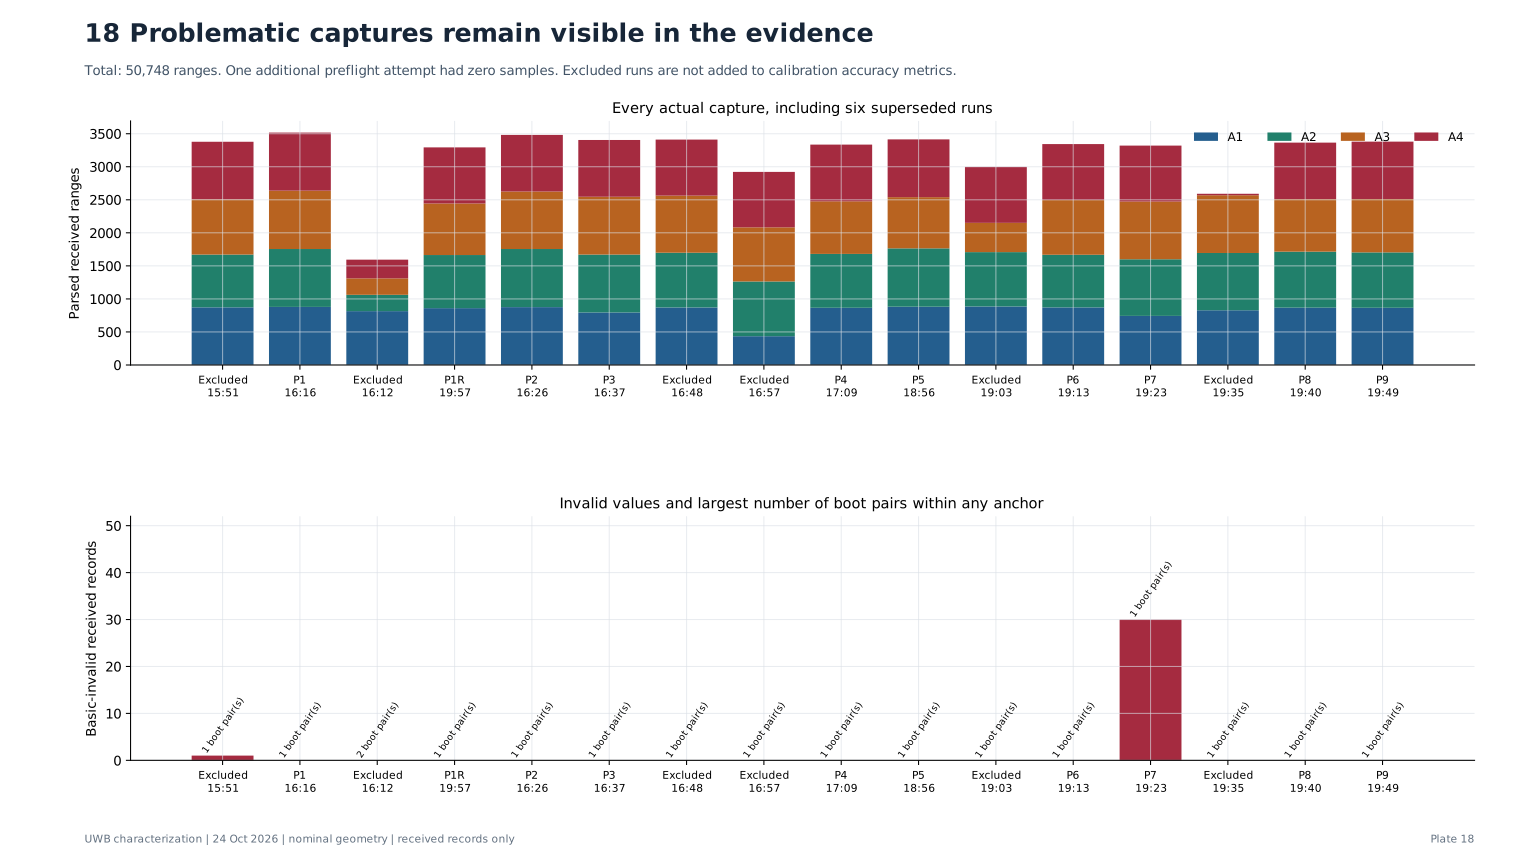
Problematic captures remain visible in the evidence
Exclusion reasons include operator-reported link problems, obstruction or anchor movement, terminal report silence and reset recovery. Their raw measurements remain archived. Counts are not accuracy rankings across changed conditions.
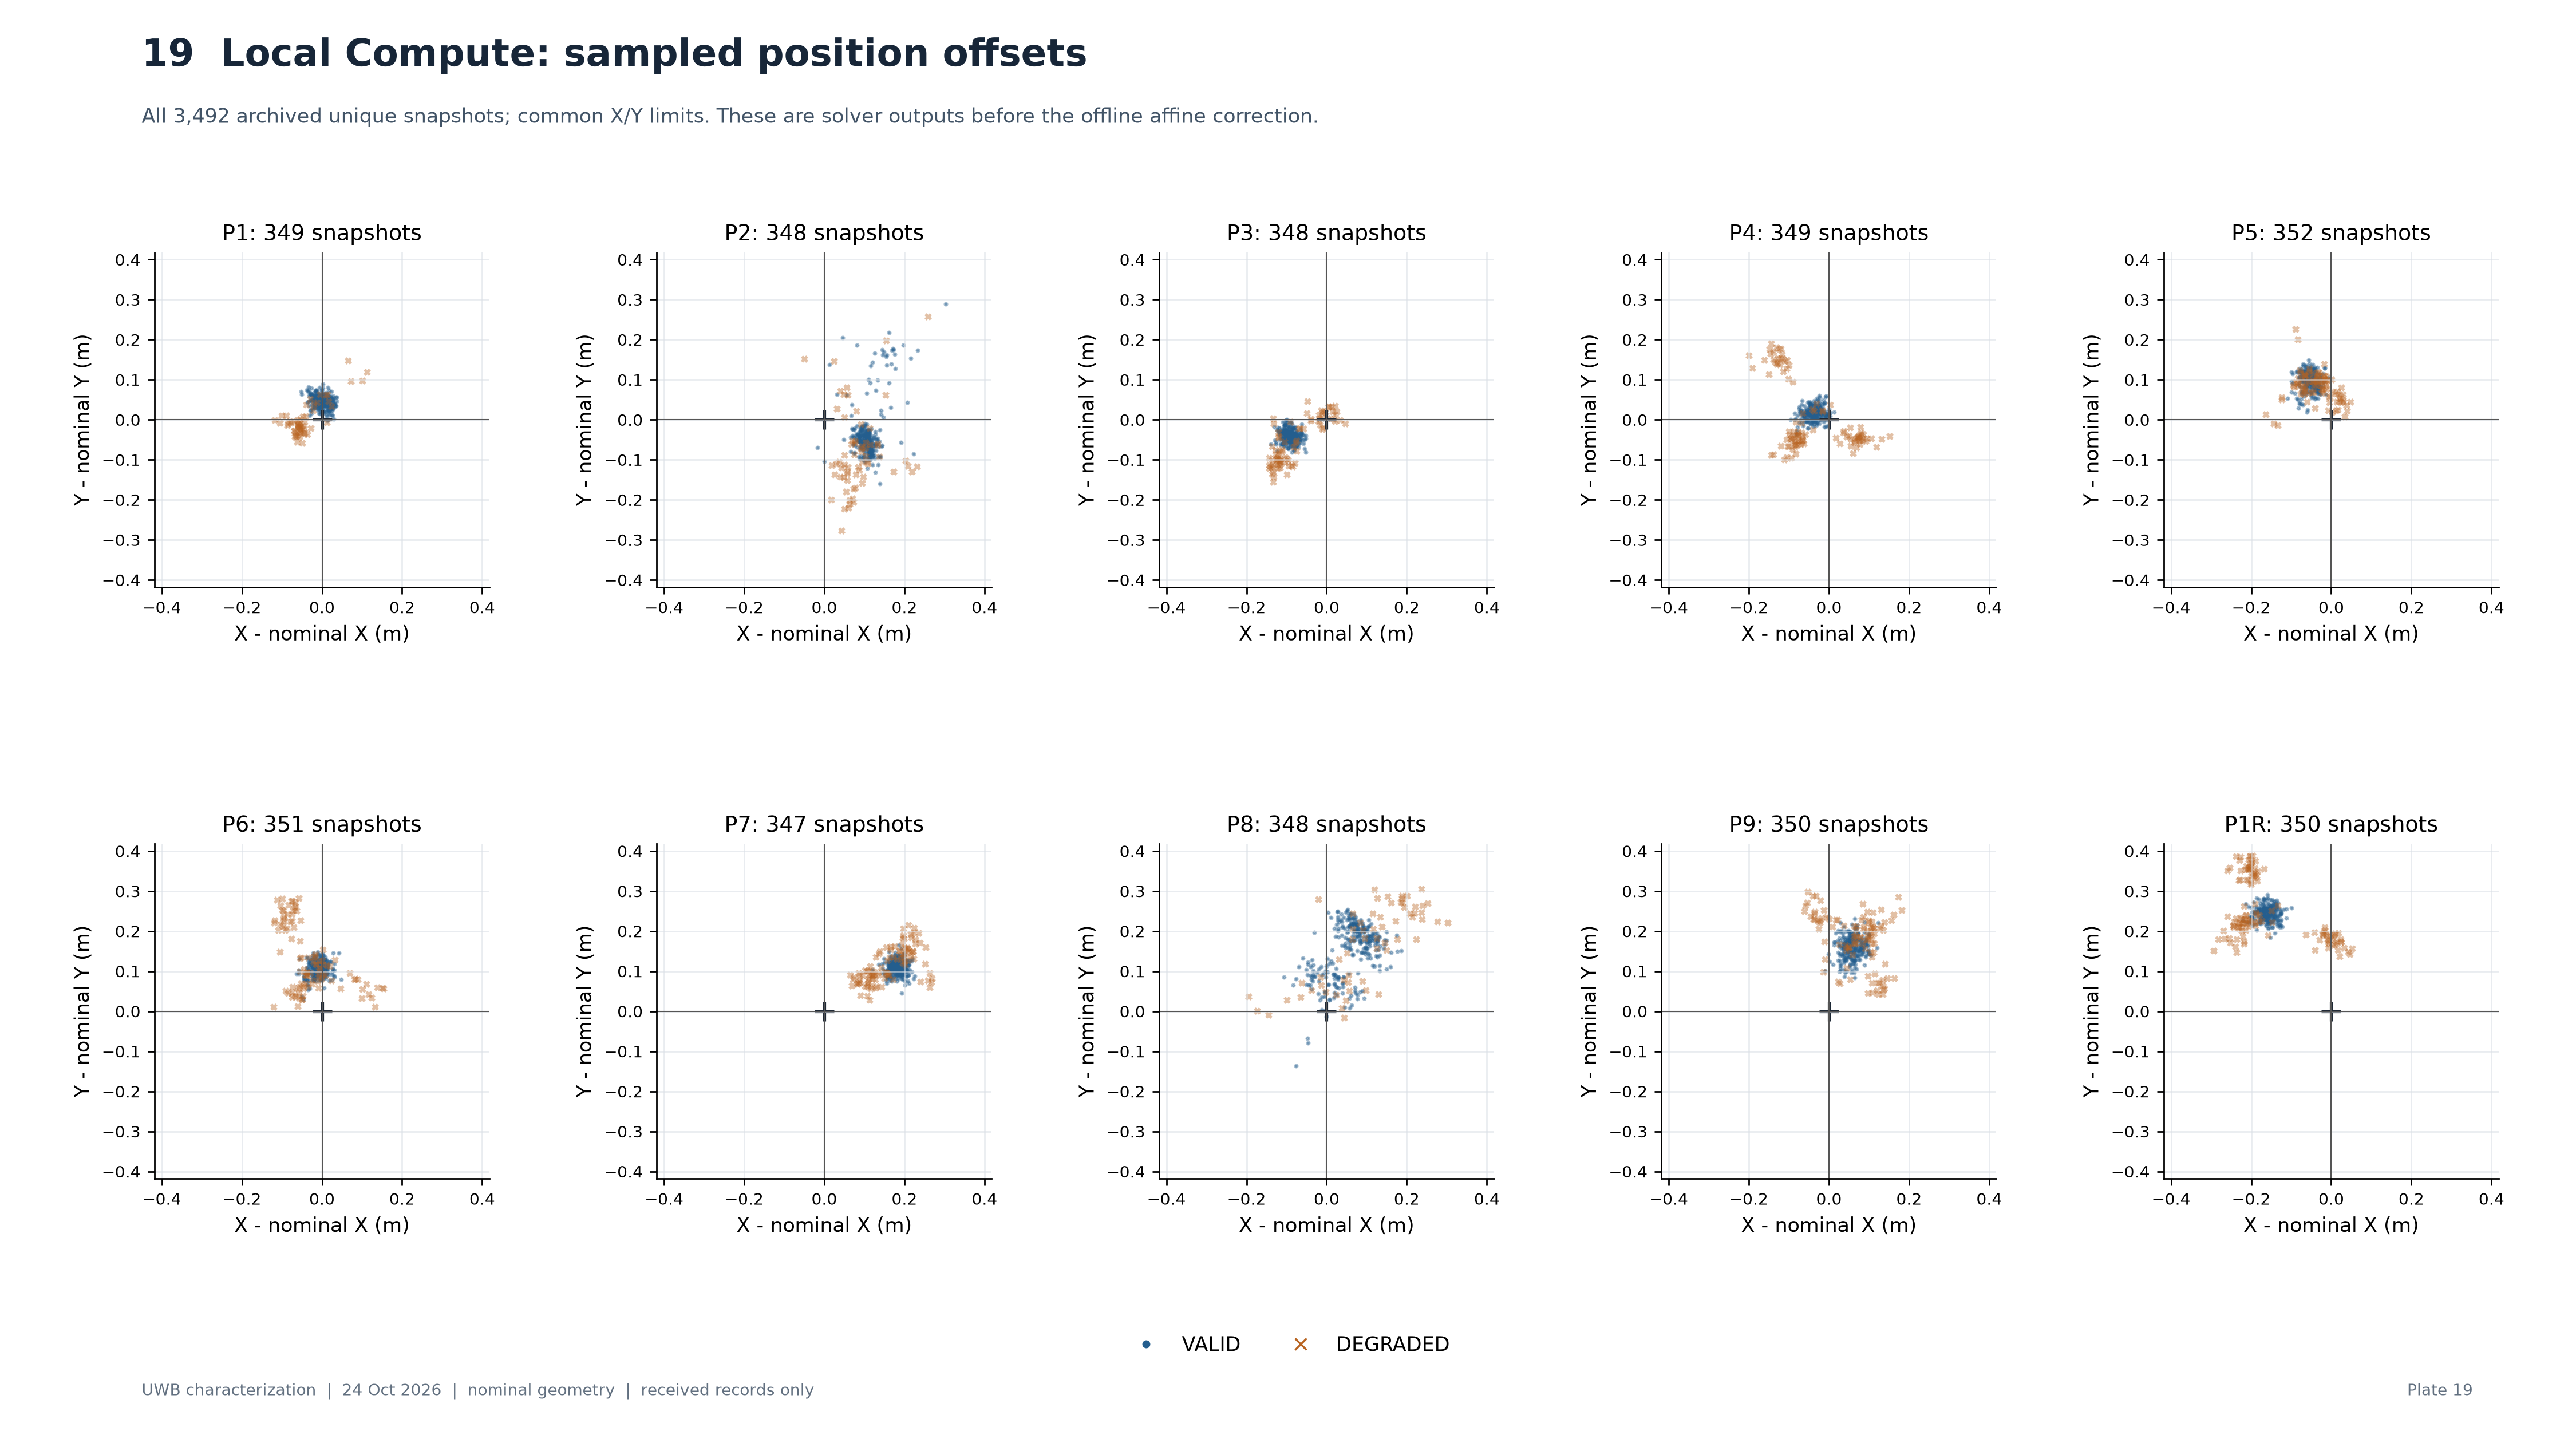
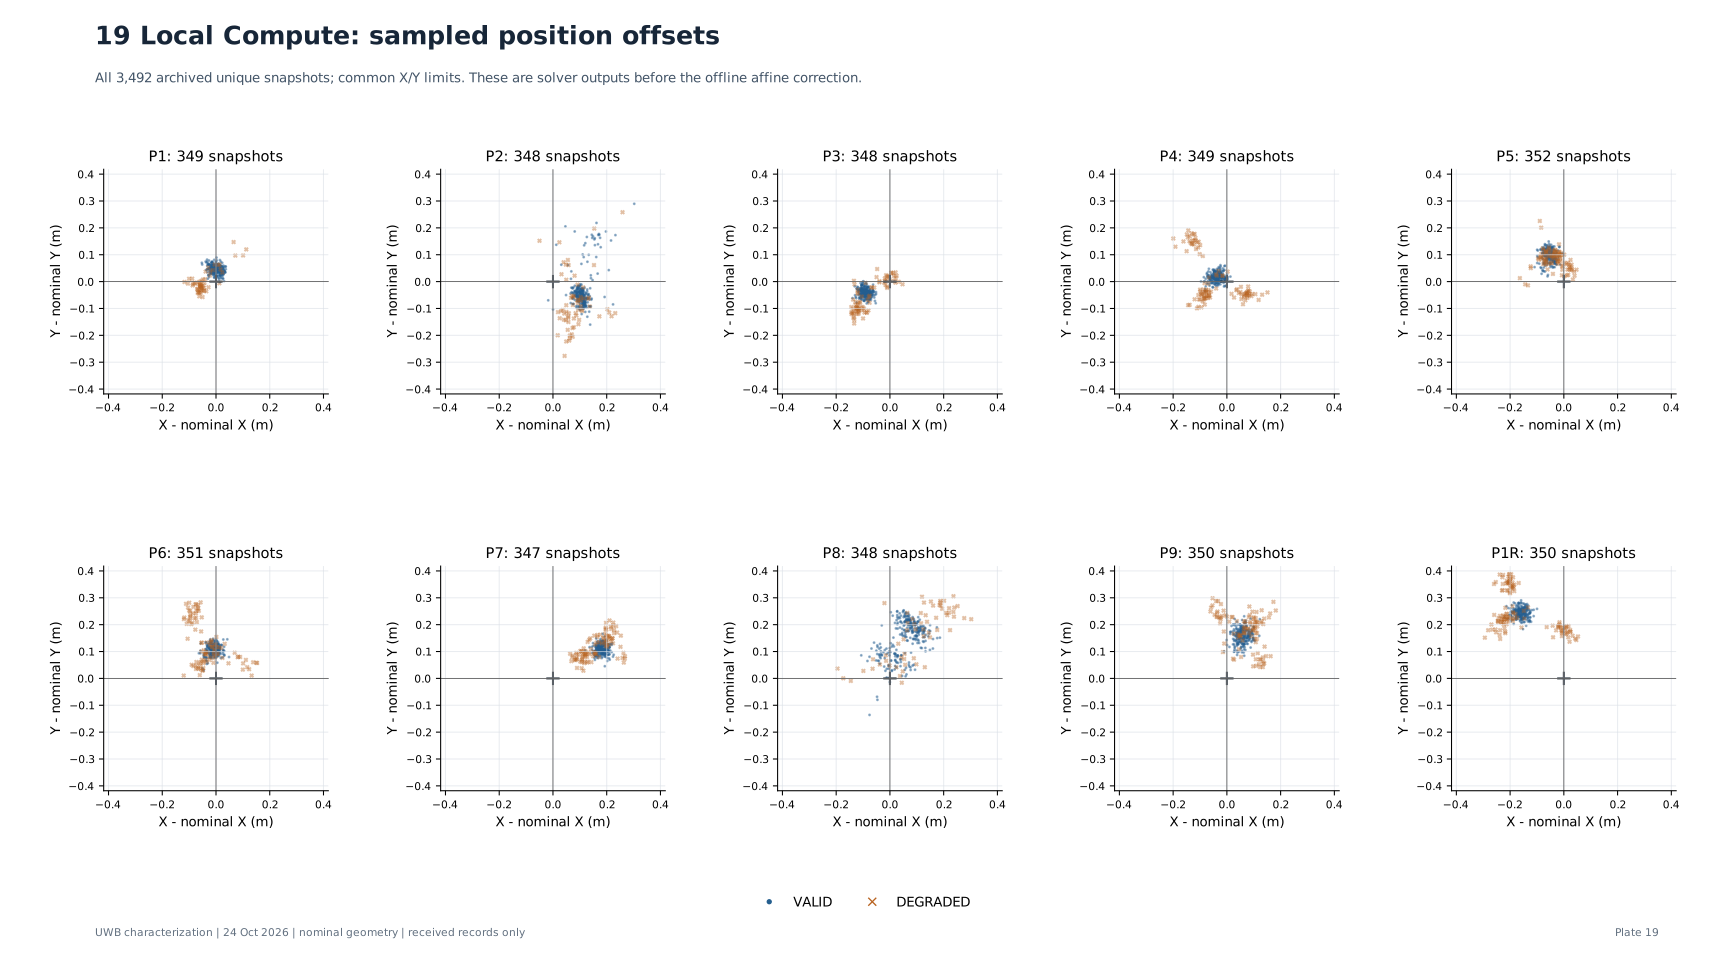
Local Compute: sampled position offsets
The plus sign is the operator nominal location. VALID and DEGRADED are solver states, not metrological acceptance. These are sampled API snapshots, not an exhaustive sequence of all computed fixes or an availability statistic.
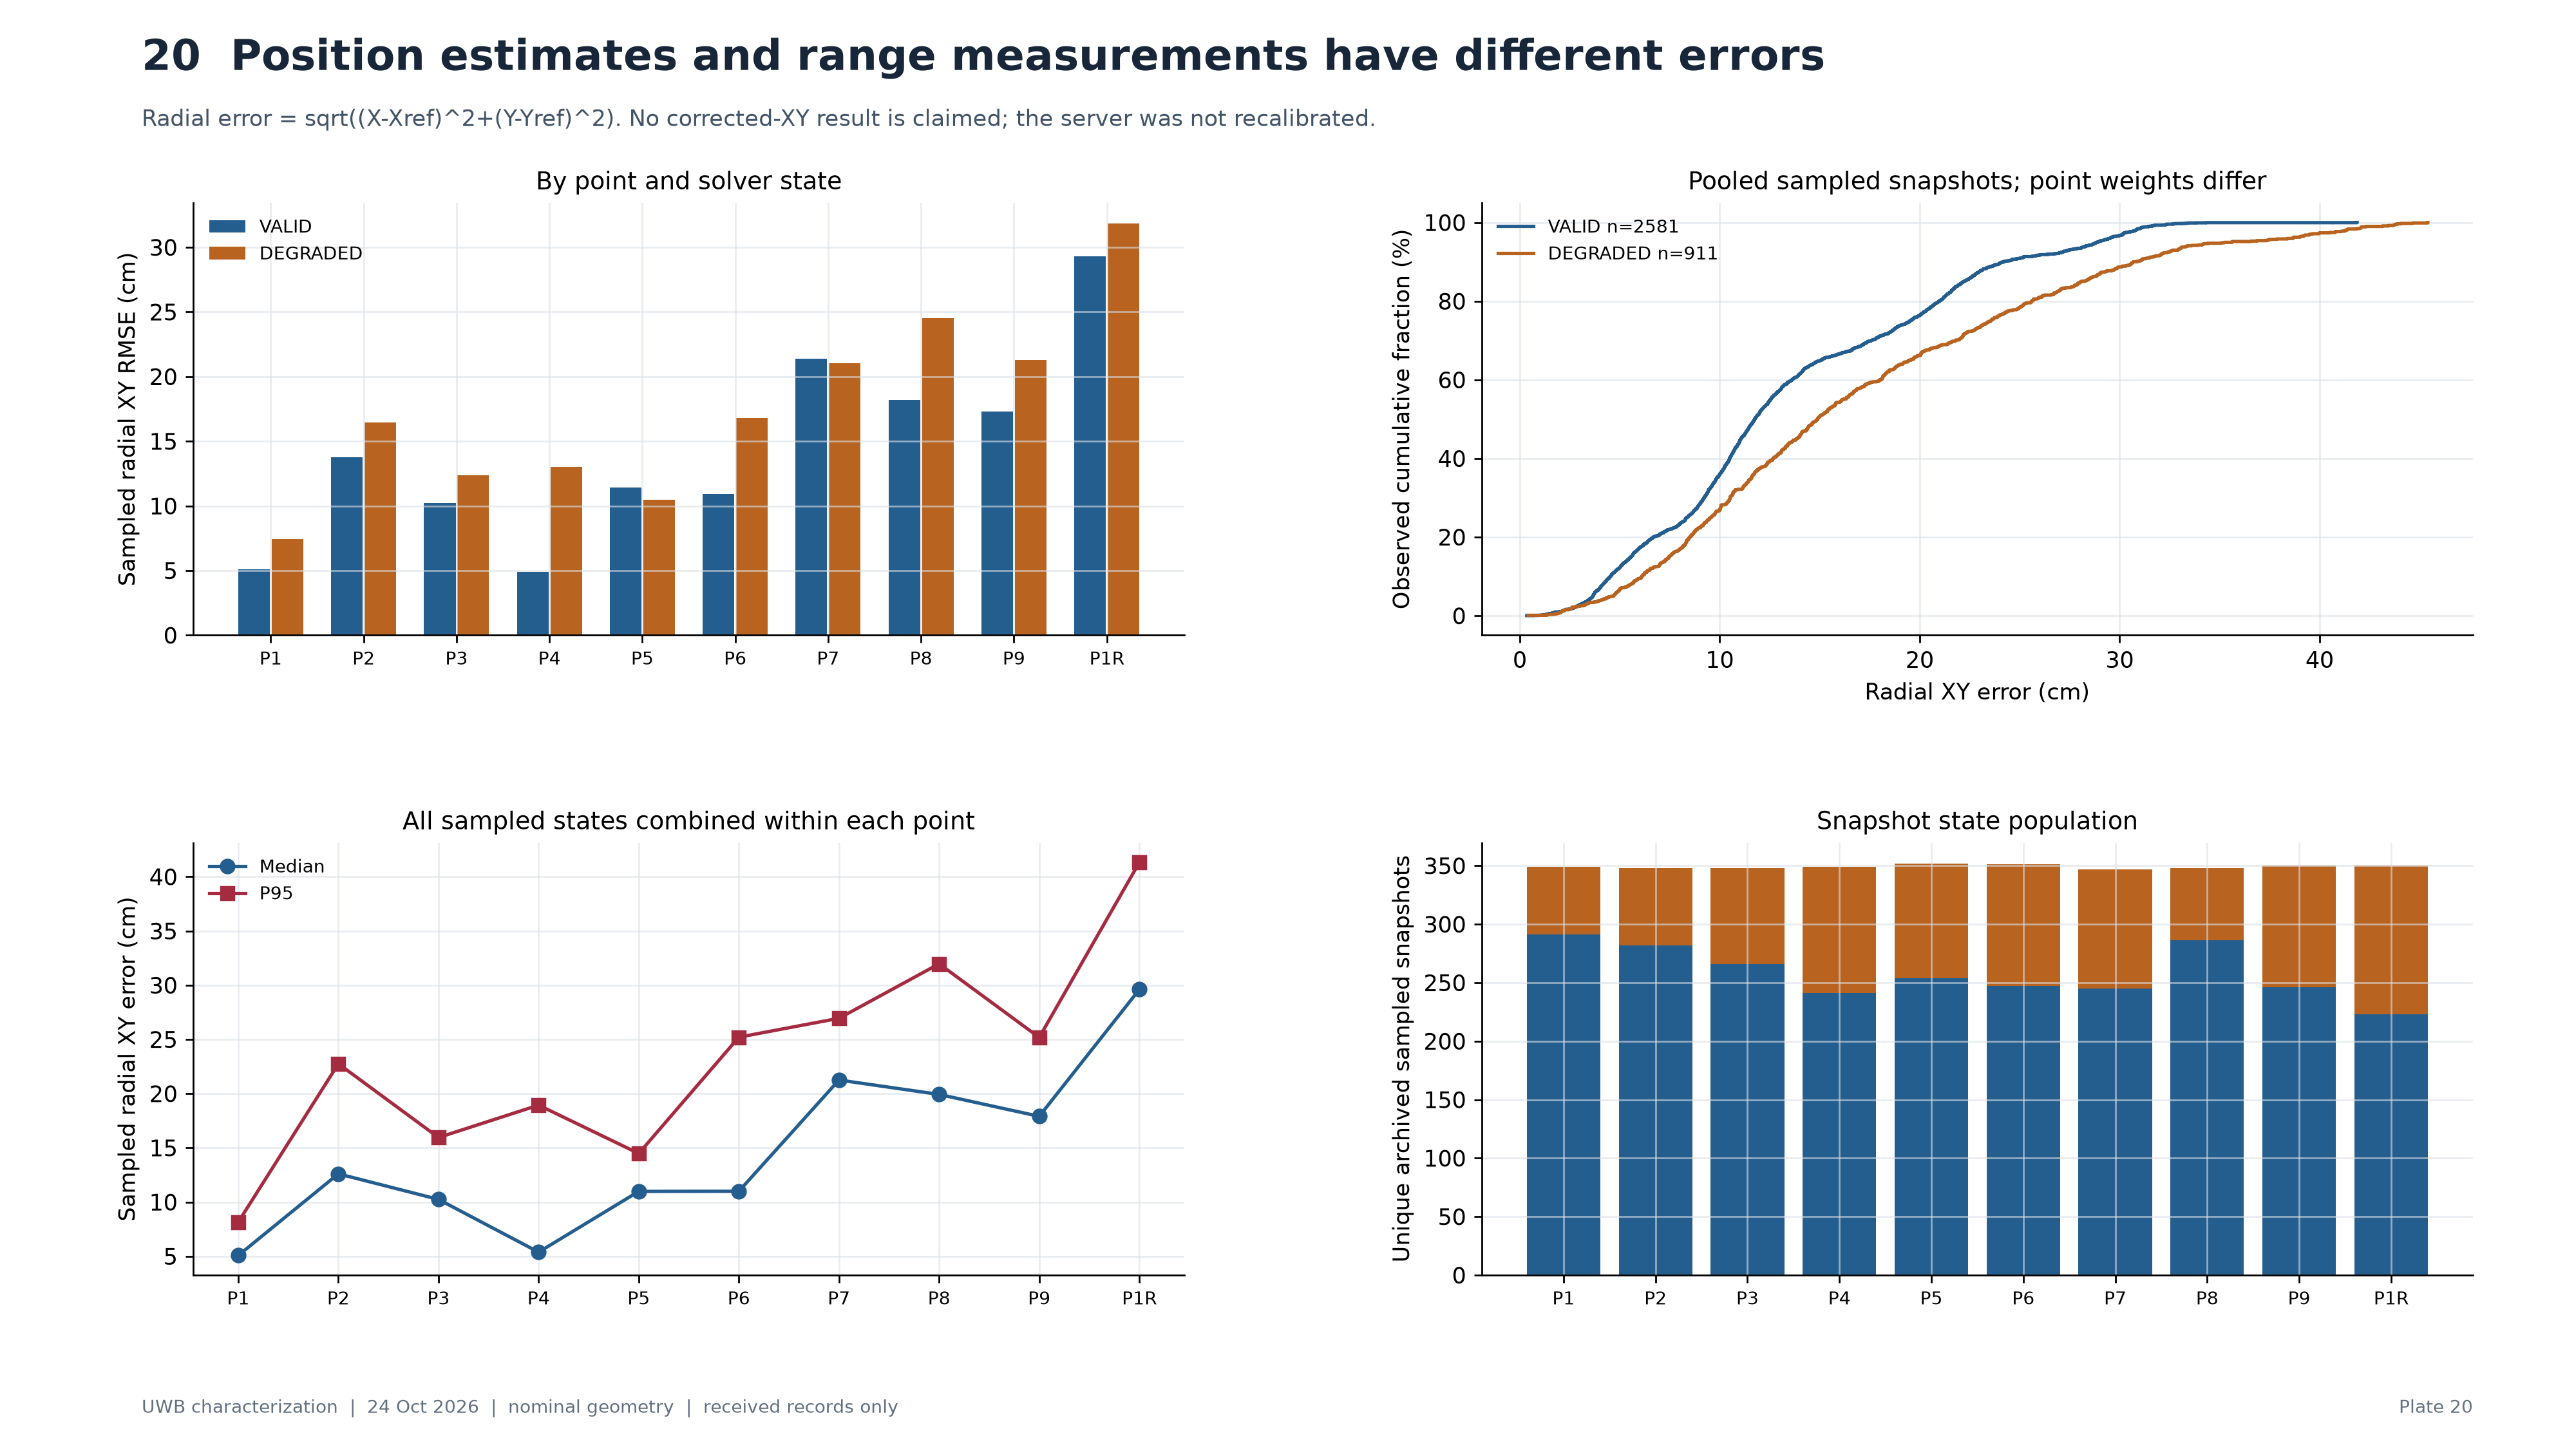
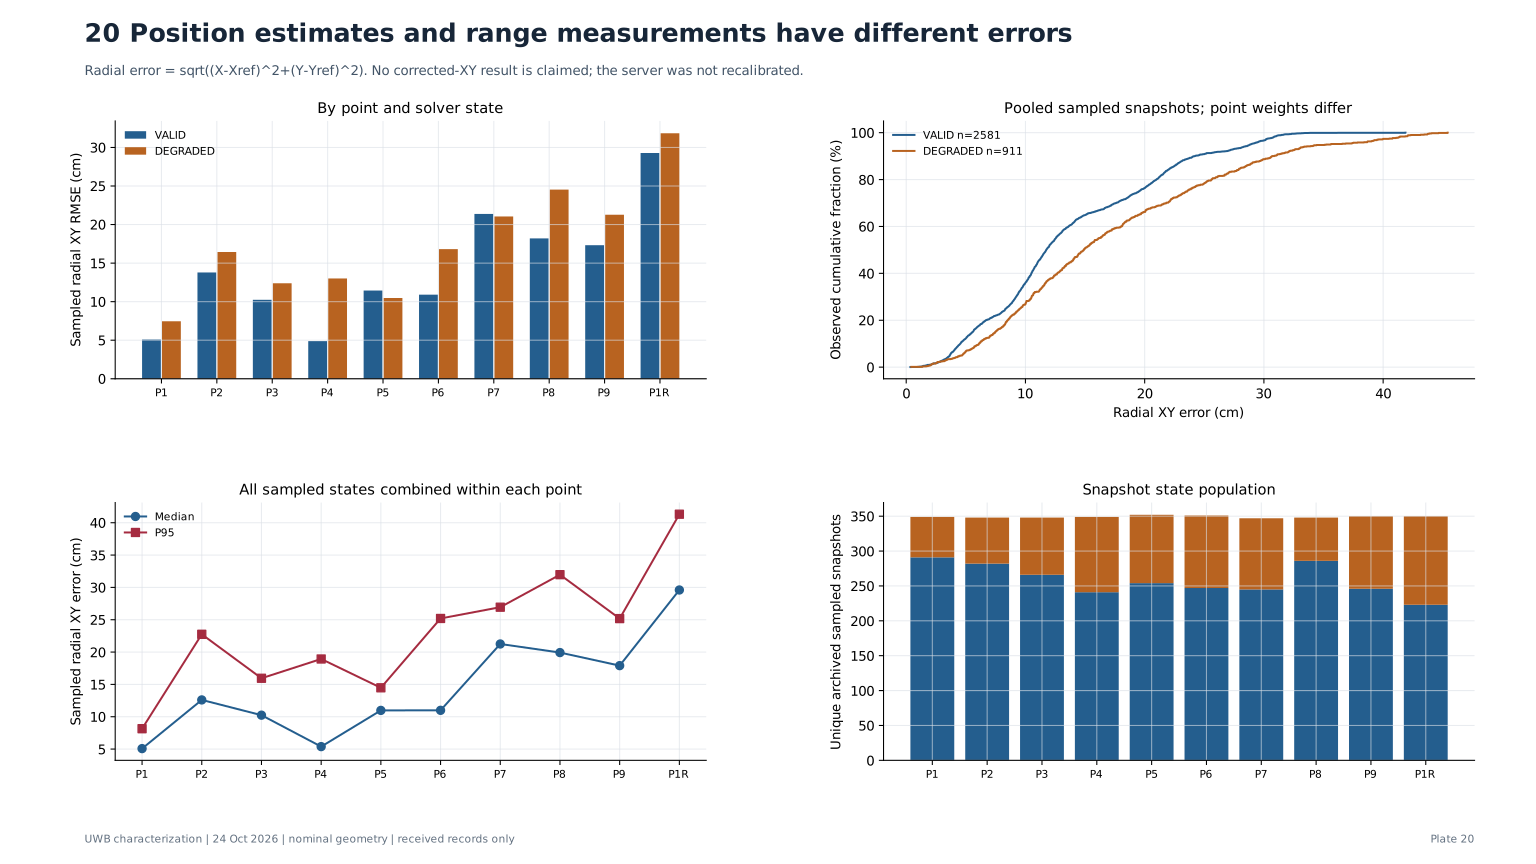
Position estimates and range measurements have different errors
State-conditioned curves can differ because point mix, geometry and available anchors differ. Do not interpret a pooled VALID/DEGRADED difference as a causal benefit of the state label. The offline range correction was not applied to these positions.